Data + Local Guides

Cape Town
Described Through Data

Data, safety scores and local guides for Cape Town and South Africa.

Scroll to today's readings
Visitor safety

Which places should tourists avoid in Cape Town?

These rules come from five years of police figures for all 63 police station areas in Cape Town and from about 1,300 news reports on crime in the city, collected for our crime reports.

Read the full story

Sources: SAPS crime statistics for the 12 months to June 2026, SANParks, and news reports collected for our crime reports, January 2023 to October 2026. Fake Uber drivers: Cape Argus, 10 and 12 July 2026, quoting Uber South Africa and Airports Company South Africa.

Crime reports

Check out our crime reports

Each report covers the police stations of one part of Cape Town: what kind of crime is recorded there, how it compares with the whole city and whether it is getting better. Select a district to open its report.

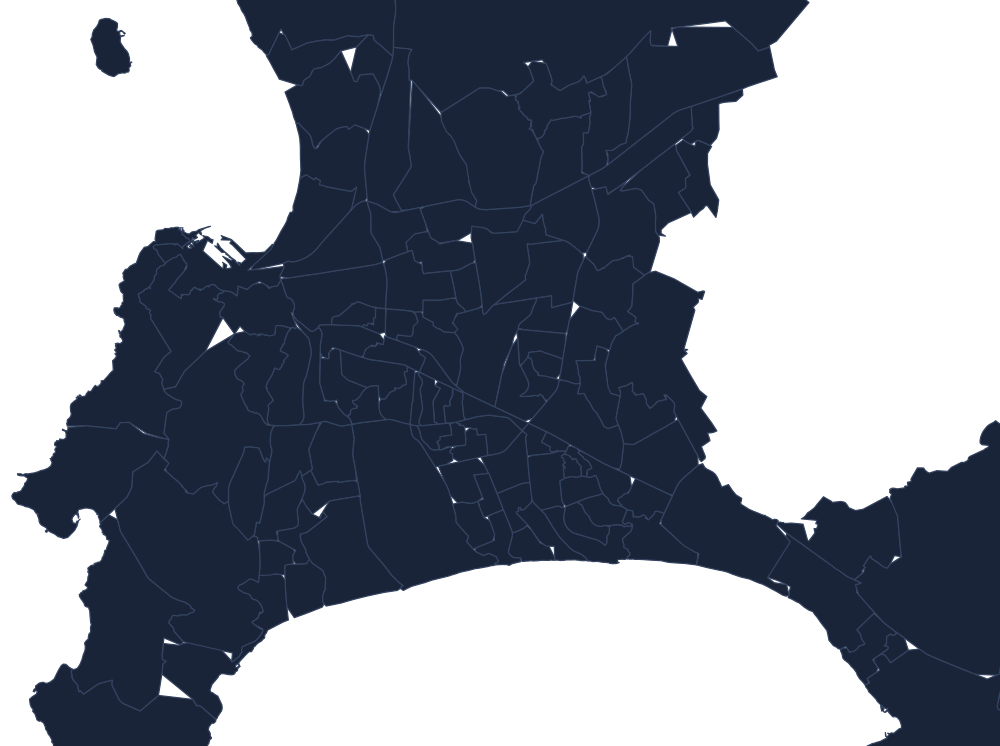
11 districts with a crime report Each point marks the centre of the area its report covers. Ward boundaries: City of Cape Town, 2021.
Visit Cape Town

Top things to do

From the Table Mountain cableway to Boulders Beach and the Stellenbosch wine farms, with the best months, what to allow and how to stay safe at each one.

All top things to do
Back tomorrow

South African song of the day

A new track leads every day. Press play, then swipe for the rest.

  • Today · Pop Umqombothi Yvonne Chaka Chaka
  • Electronic (Cape Town) Fort Knox Goldfish
  • Isicathamiya Homeless Ladysmith Black Mambazo
  • Afropop Khona Mafikizolo feat. Uhuru
  • Cape Jazz Teardrop (live at the Baxter) Kyle Shepherd Trio
  • Pop Burn Out Sipho "Hotstix" Mabuse
  • Afro-house Jerusalema Master KG feat. Nomcebo Zikode
  • Afropop Special Star Mango Groove
  • Indie folk (Cape Town) She Alice Phoebe Lou
  • Afro-house Akanamali Sun-El Musician feat. Samthing Soweto
  • Jazz Stimela (The Coal Train) Hugh Masekela
  • Kwaito Thathisigubhu Bongo Maffin
  • Indie (Cape Town) Down South Jeremy Loops feat. Motheo Moleko
  • Afropop Scatterlings of Africa Johnny Clegg and Savuka
  • Afro-house Drive Black Coffee, David Guetta and Delilah Montagu
  • Cape Jazz Sabenza Basil Coetzee
  • Afropop Doo Be Doo Freshlyground
  • Pop Weekend Special Brenda & The Big Dudes
  • Gqom Omunye Distruction Boyz
  • Folk The Click Song (Qongqothwane) Miriam Makeba
  • Afro-soul Joy (We Are Family) The Soil
  • Pop Weeping Bright Blue
  • Afro-house Osama Zakes Bantwini feat. Kasango
  • Afropop John Cena Sho Madjozi
  • Cape Jazz Mannenberg Abdullah Ibrahim
  • Afropop Pata Pata Miriam Makeba
  • Kwaito Shibobo TKZee
  • Afropop Asimbonanga Johnny Clegg and Savuka
  • Amapiano-pop Water Tyla
  • Cape Jazz Yakhal' Inkomo Winston Mankunku Ngozi
  • Pop Vulindlela Brenda Fassie
  • Gqom Wololo Babes Wodumo feat. Mampintsha
  • Jazz Grazing in the Grass Hugh Masekela
  • Indie (Cape Town) Rafael Beatenberg
  • Reggae Together as One Lucky Dube
  • Kwaito Nkalakatha Mandoza
  • Isicathamiya Mbube Solomon Linda's Original Evening Birds
  • Amapiano Asibe Happy Kabza De Small and DJ Maphorisa feat. Ami Faku
  • Cape Jazz Ghoema Robbie Jansen

Today's music challenge

A new round of ten South African song clips every day.
Play
Neighbourhood safety

How safe is the neighbourhood?

Each card is a neighbourhood. Its score is the Ward Safety Index of the City electoral ward it lies in, or a weighted average where it spans more than one; the card names each ward and the other suburbs it covers. Scores and sub-scores run 0 to 10, higher is safer. A new set every day, in alphabetical order.

Pillar scores describe what kind of crime is the problem in an area; they are analyst decompositions of the ward score, not independent measurements.

Source: Ward research, SAPS station statistics, GI-TOC Gang Monitor · Last refreshed 2026-09

Latest chart

All charts ↗

70 charts across 11 topics, every one with a source

Which day and hour is worst for driving to the airport?

53minutes Tue 16:00 · Highest

Drive time from the city to the airport, for every hour of every day
14.9 53 minutes MonTueWedThuFriSatSun Mon 03:00: 14.9 minutes Mon 04:00: 15.1 minutes Mon 05:00: 15.2 minutes Mon 06:00: 15.4 minutes Mon 07:00: 16 minutes Mon 08:00: 16.1 minutes Mon 09:00: 16.4 minutes Mon 10:00: 16.4 minutes Mon 11:00: 16.5 minutes Mon 12:00: 16.5 minutes Mon 13:00: 16.8 minutes Mon 14:00: 17.9 minutes Mon 15:00: 33.4 minutes Mon 16:00: 42.4 minutes Mon 17:00: 37.8 minutes Mon 18:00: 21.5 minutes Mon 19:00: 16.7 minutes Mon 20:00: 16.1 minutes Mon 21:00: 15.9 minutes Tue 04:00: 15.5 minutes Tue 05:00: 15.2 minutes Tue 06:00: 15.8 minutes Tue 07:00: 16.3 minutes Tue 08:00: 16.5 minutes Tue 09:00: 16.4 minutes Tue 10:00: 16.6 minutes Tue 11:00: 16.8 minutes Tue 12:00: 17 minutes Tue 13:00: 18.6 minutes Tue 14:00: 19.6 minutes Tue 15:00: 42.1 minutes Tue 16:00: 53 minutes 53 Tue 17:00: 42.3 minutes Tue 18:00: 21 minutes Tue 19:00: 16.6 minutes Tue 20:00: 16.5 minutes Tue 21:00: 16.1 minutes Wed 04:00: 15.3 minutes Wed 05:00: 15.3 minutes Wed 06:00: 15.8 minutes Wed 07:00: 16.2 minutes Wed 08:00: 16.4 minutes Wed 09:00: 16.3 minutes Wed 10:00: 16.5 minutes Wed 11:00: 16.8 minutes Wed 12:00: 17.1 minutes Wed 13:00: 17.2 minutes Wed 14:00: 18.8 minutes Wed 15:00: 38 minutes Wed 16:00: 50.4 minutes Wed 17:00: 41.6 minutes Wed 18:00: 20.7 minutes Wed 19:00: 16.6 minutes Wed 20:00: 16.6 minutes Wed 21:00: 16.3 minutes Thu 04:00: 15.5 minutes Thu 05:00: 15.3 minutes Thu 06:00: 15.8 minutes Thu 07:00: 16.2 minutes Thu 08:00: 16.4 minutes Thu 09:00: 16.5 minutes Thu 10:00: 16.7 minutes Thu 11:00: 16.8 minutes Thu 12:00: 17.1 minutes Thu 13:00: 17.4 minutes Thu 14:00: 20.6 minutes Thu 15:00: 40.2 minutes Thu 16:00: 51 minutes Thu 17:00: 41.4 minutes Thu 18:00: 24.4 minutes Thu 19:00: 17.4 minutes Thu 20:00: 16.7 minutes Thu 21:00: 16.1 minutes Fri 04:00: 15.4 minutes Fri 05:00: 15.7 minutes Fri 06:00: 16 minutes Fri 07:00: 16.3 minutes Fri 08:00: 16.7 minutes Fri 09:00: 16.7 minutes Fri 10:00: 16.8 minutes Fri 11:00: 17 minutes Fri 12:00: 17.7 minutes Fri 13:00: 19.3 minutes Fri 14:00: 24.3 minutes Fri 15:00: 39.9 minutes Fri 16:00: 39.1 minutes Fri 17:00: 25.6 minutes Fri 18:00: 17.3 minutes Fri 19:00: 16.7 minutes Fri 20:00: 16.6 minutes Fri 21:00: 16.2 minutes Sat 04:00: 15.3 minutes Sat 05:00: 15.3 minutes Sat 06:00: 15.3 minutes Sat 07:00: 15.2 minutes Sat 08:00: 15.3 minutes Sat 09:00: 15.7 minutes Sat 10:00: 16.1 minutes Sat 11:00: 17.1 minutes Sat 12:00: 17.8 minutes Sat 13:00: 17.9 minutes Sat 14:00: 17.8 minutes Sat 15:00: 18.5 minutes Sat 16:00: 17.4 minutes Sat 17:00: 17.5 minutes Sat 18:00: 17.5 minutes Sat 19:00: 16.8 minutes Sat 20:00: 16.6 minutes Sat 21:00: 16.4 minutes Sun 03:00: 14.9 minutes Sun 04:00: 15.3 minutes Sun 05:00: 15.2 minutes Sun 06:00: 15 minutes Sun 07:00: 15.1 minutes Sun 08:00: 15 minutes Sun 09:00: 15.2 minutes Sun 10:00: 15.6 minutes Sun 11:00: 15.8 minutes Sun 12:00: 15.9 minutes Sun 13:00: 15.8 minutes Sun 14:00: 16.4 minutes Sun 15:00: 16.1 minutes Sun 16:00: 16 minutes Sun 17:00: 17 minutes Sun 18:00: 16.7 minutes Sun 19:00: 18.8 minutes Sun 20:00: 18.8 minutes Sun 21:00: 16.4 minutes 03:0006:0009:0012:0015:0018:0021:00

Select a cell to inspect its value.

The slowest time of the week is a weekday afternoon. The drive then takes more than twice as long as at a quiet hour.

Source: Cape Town Data (Google Maps drive-time sampling) · 10 Mar 2026 – 30 Mar 2026 · Light is low, dark is high: 14.9 to 53 minutes

Explore chart ↗

More charts

  • Crime 30 Jun 2026

    Where do the police record the most crime, and where is it most violent?

    53% Hout Bay · Highest

    Crimes recorded by the police in 12 months, compared with how many of them are violent
    0 20 40 60 0502005001,0002,0005,00010,000 Crimes, 12 months Violent share (%) Atlantic Seaboard: Crimes, 12 months 2,421, Violent share (%) 14, Total crimes recorded by the police 2,421 Table View: Crimes, 12 months 3,379, Violent share (%) 39, Total crimes recorded by the police 3,379 Camps Bay & Clifton: Crimes, 12 months 411, Violent share (%) 17, Total crimes recorded by the police 411 City Bowl: Crimes, 12 months 8,278, Violent share (%) 34, Total crimes recorded by the police 8,278 City Bowl Hout Bay: Crimes, 12 months 1,268, Violent share (%) 53, Total crimes recorded by the police 1,268 Hout Bay Milnerton: Crimes, 12 months 3,545, Violent share (%) 52, Total crimes recorded by the police 3,545 Muizenberg: Crimes, 12 months 1,679, Violent share (%) 51, Total crimes recorded by the police 1,679 Stellenbosch: Crimes, 12 months 4,956, Violent share (%) 43, Total crimes recorded by the police 4,956 Woodstock: Crimes, 12 months 2,380, Violent share (%) 32, Total crimes recorded by the police 2,380

    Select a bubble to inspect its values.

    The districts where the police record the most crime are not the ones with the highest share of violent crime.

    Source: South African Police Service, via our district crime reports · Left to right: Crimes recorded by the police in 12 months. Bottom to top: Share of those crimes that are violent (%). Bubble area: Total crimes recorded by the police. The horizontal scale is stretched at the low end so small numbers are easier to see

  • Economy 1 Nov 2026

    How many rand does one euro cost?

    18.73R ▲ +0.05 · +0.3 % · since 10 Aug

    The rate at the end of each week, last twelve weeks
    R 18 18.25 18.5 18.75 19 10 Aug: 18.68 R 10 Aug 17 Aug: 18.74 R 24 Aug: 18.69 R 24 Aug 31 Aug: 18.72 R 7 Sep: 18.61 R 7 Sep 14 Sep: 18.77 R 18.77 21 Sep: 18.63 R 21 Sep 28 Sep: 18.68 R 5 Oct: 18.68 R 5 Oct 12 Oct: 18.46 R 19 Oct: 18.43 R 18.43 19 Oct 26 Oct: 18.61 R 1 Nov: 18.73 R 1 Nov 18.73

    Select a point to inspect its value.

    Over the last twelve weeks the rand has stayed in a narrow range against the euro too.

    Source: Open Exchange Rates · The scale runs from 18 to 19, not from zero

    Explore chart ↗
  • Transport 30 Mar 2026

    The drive from the airport is slowest early in the morning

    70.3minutes 07:00 · Highest

    Average drive time from the airport to the city, Monday to Friday
    minutes 0 25 50 75 100 03:00: 17.2 minutes 03:00 04:00: 17.1 minutes 17.1 05:00: 23.5 minutes 06:00: 61.7 minutes 06:00 07:00: 70.3 minutes 70.3 08:00: 47.9 minutes 09:00: 32.3 minutes 09:00 10:00: 23.6 minutes 11:00: 21.8 minutes 12:00: 23.2 minutes 12:00 13:00: 22.4 minutes 14:00: 21.7 minutes 15:00: 22.1 minutes 15:00 16:00: 21.6 minutes 17:00: 24.6 minutes 18:00: 21.8 minutes 18:00 19:00: 18.7 minutes 20:00: 18.5 minutes 21:00: 18.2 minutes 21:00 18.2

    Select a point to inspect its value.

    Early in the morning the drive into the city takes more than twice as long as at quiet times.

    Source: Cape Town Data (Google Maps drive-time sampling) · The scale runs from zero to 100

    Explore chart ↗
  • Environment 2 Nov 2026

    The satellite keeps seeing heat at the same few places

    69days seen Piketberg (4 km) · Highest

    Places where heat was spotted on four or more days
    Piketberg (4 km): 69 days seen Piketberg (4 km) 69 Vredenburg (8 km): 65 days seen Vredenburg (8 km) 65 Cape Town International Airport (2.1 km): 30 days seen Cape Town Internati… 30 Milnerton (6.6 km): 29 days seen Milnerton (6.6 km) 29 Stellenbosch (18 km): 13 days seen Stellenbosch (18 km) 13 Piketberg (43.5 km): 7 days seen Piketberg (43.5 km) 7 +2 more

    Select a bar to inspect its value.

    These places show up again and again. They are often factories or farm burning rather than wildfires. The one near Piketberg shows up most often.

    Source: NASA FIRMS (VIIRS 375 m) · All bars start at zero

    Explore chart ↗
  • Weather 1 Nov 2026

    Cape Town gets its rain in a few heavy days

    43mm Wed 21 Oct · Highest

    Rain each day in the City Bowl, last two weeks
    mm 0 20 40 60 Mon 19 Oct: 0 mm Mon 19 Oct Tue 20 Oct: 0 mm Wed 21 Oct: 43 mm 43 Thu 22 Oct: 10 mm 10 Thu 22 Oct Fri 23 Oct: 0 mm Sat 24 Oct: 0 mm Sun 25 Oct: 0 mm Sun 25 Oct Mon 26 Oct: 0 mm Tue 27 Oct: 0 mm Wed 28 Oct: 0 mm Wed 28 Oct Thu 29 Oct: 0 mm Sat 31 Oct: 0 mm Sun 1 Nov: 0 mm Sun 1 Nov

    Select a point to inspect its value.

    Most of the rain in these two weeks fell on just a few days. The other days were dry.

    Source: South African Weather Service · The scale runs from zero to 60

    Explore chart ↗
  • Tourism 31 Dec 2026

    The winelands hold 19 starred restaurants, more than any part of Cape Town itself

    19starred restaurants Stellenbosch and Franschhoek · Highest

    Restaurants holding one, two or three Eat Out stars in 2026, by area.
    Stellenbosch and Franschhoek: 19 starred restaurants Stellenbosch and F… 19 Cape Town CBD and City Bowl: 11 starred restaurants Cape Town CBD and C… 11 Rest of Western Cape: 8 starred restaurants Rest of Western Cape 8 Woodstock and suburbs: 7 starred restaurants Woodstock and subur… 7 V&A Waterfront: 6 starred restaurants V&A Waterfront 6 Gauteng: 5 starred restaurants Gauteng 5 +4 more

    Select a bar to inspect its value.

    Stellenbosch and Franschhoek together outrank every city district, and Gauteng holds only five stars in total.

    Source: Eat Out · All bars start at zero

    Explore chart ↗
  • Population 28 Feb 2025

    Home Affairs cleared about 94% of its visa backlog in under a year

    306,000applications April 2024 · Highest

    Unprocessed visa and permit applications at the Department of Home Affairs.
    April 2024: 306,000 applications April 2024 306,000 February 2025: 18,000 applications February 2025 18,000

    Select a bar to inspect its value.

    The queue fell from 306,000 applications to roughly 18,000, and was declared eradicated in early 2025.

    Source: Department of Home Affairs · All bars start at zero

    Explore chart ↗
  • Water 29 May 2026

    After the May storms Wemmershoek stood at 96% and Steenbras Lower at 53%

    96% Wemmershoek · Highest

    How full each of the six big dams was on 29 May 2026
    Wemmershoek: 96 % Wemmershoek 96 Steenbras Upper: 81 % Steenbras Upper 81 Berg River: 77 % Berg River 77 Theewaterskloof: 73 % Theewaterskloof 73 Voëlvlei: 59 % Voëlvlei 59 Steenbras Lower: 53 % Steenbras Lower 53

    Select a bar to inspect its value.

    The smaller dams close to the city got the most rain, so some dams filled much more than others.

    Source: City of Cape Town · All bars start at zero

    Explore chart ↗
  • Property 30 Apr 2026

    Cape Town house prices grew 11.0% in the year to April 2026, double Johannesburg's

    11% Cape Town · Highest

    How much house prices rose in the twelve months to April 2026
    Cape Town: 11 % Cape Town 11 All metros: 7.6 % All metros 7.6 Johannesburg: 5.4 % Johannesburg 5.4 Tshwane: 3.8 % Tshwane 3.8

    Select a bar to inspect its value.

    Cape Town is not only the most expensive big city. Its prices are also rising faster than in the other big cities shown.

    Source: Statistics South Africa · All bars start at zero

    Explore chart ↗
  • Energy 31 Dec 2026

    Planned data centres would need a third as much power as the whole of Cape Town at its peak

    1,096MW All other Cape Town demand · Highest

    Power needed by four planned data centres, compared with the city’s peak demand of 1,676 MW
    Cavaleros (Cosmas Data City): 360 MW Cavaleros (Cosmas D… 360 Equinix (two facilities): 160 MW Equinix (two facili… 160 Teraco: 60 MW Teraco 60 All other Cape Town demand: 1,096 MW All other Cape Tow… 1,096

    Select a bar to inspect its value.

    Together they would need 580 MW, which is 34% of the city’s current peak. The biggest, Cavaleros at 360 MW, would be the largest data centre ever built in South Africa.

    Source: City of Cape Town, Cavaleros Group, Equinix and Teraco · All bars start at zero

    Explore chart ↗
  • Politics 30 Jun 2025

    Two thirds of Western Cape municipalities earned a clean audit, against 15% nationally

    67% Western Cape · Highest

    Share of municipalities whose 2024/25 accounts passed their audit with no problems found
    Western Cape: 67 % Western Cape 67 National: 15 % National 15

    Select a bar to inspect its value.

    67% of Western Cape municipalities got a clean audit. That is more than four times the national rate of 15%.

    Source: Auditor-General of South Africa · All bars start at zero

    Explore chart ↗
  • Crime 30 Jun 2026

    Does each district have the same kinds of crime?

    8,278recorded crimes City Bowl · Highest

    Which crimes are most common in each district
    Atlantic Seaboard: Murder 1, Sexual offences 19, Robbery 178, Assault 147, Break-ins 104, Car crime 1,116, Theft 856 Atlantic Seaboard Table View: Murder 34, Sexual offences 88, Robbery 545, Assault 657, Break-ins 386, Car crime 593, Theft 1,076 Table View Camps Bay & Clifton: Murder 1, Sexual offences 11, Robbery 15, Assault 41, Break-ins 41, Car crime 109, Theft 193 Camps Bay& Clifton City Bowl: Murder 7, Sexual offences 108, Robbery 1,913, Assault 762, Break-ins 188, Car crime 2,018, Theft 3,282 City Bowl Hout Bay: Murder 33, Sexual offences 35, Robbery 90, Assault 516, Break-ins 103, Car crime 94, Theft 397 Hout Bay Milnerton: Murder 95, Sexual offences 95, Robbery 847, Assault 807, Break-ins 302, Car crime 557, Theft 842 Milnerton Muizenberg: Murder 78, Sexual offences 43, Robbery 306, Assault 427, Break-ins 135, Car crime 270, Theft 420 Muizenberg Stellenbosch: Murder 71, Sexual offences 135, Robbery 815, Assault 1,132, Break-ins 486, Car crime 966, Theft 1,351 Stellenbosch +1 more

    Select a chart to inspect its values.

    Each shape shows which crimes are most common in one district. The shapes show the mix, not how much crime there is. City Bowl has the most recorded crime overall.

    Source: South African Police Service, via our district crime reports · Each shape is sized to its own district, so compare the shapes, not the sizes

  • From our stories Is it safe to stay in Somerset West, Western Cape?

    Is it safe to stay in Somerset West, Western Cape?

    0 105 210 315 420 REPORTED INCIDENTS PER YEAR 64 125 Street robbery 25 34 House robbery 97 120 Theft of vehicle 407 371 Home burglary 32 16 Business robbery 6 5 Murder

    Source: Is it safe to stay in Somerset West, Western Cape? · Updated 27 Oct 2026

    Read the story ↗
  • From our stories Table Mountain and Lion's Head: safety in 2026

    Table Mountain and Lion's Head: safety in 2026

    Jan Feb Mar Apr May Jun Jul Aug Sep Oct Nov Dec 2025 2026 peak season Only dated incidents from published rescue and news reports. WSAR handles many more callouts than make the news.

    Source: SANParks (18 Dec 2025); capetowndata.com 2026 incident log (Jan to Jun 2026); IOL (17 May); Cape {town} Etc (31 Jul); c… · Updated 22 Oct 2026

    Read the story ↗
  • From our stories What are the Biggest Events in Cape Town in 2027? The Month-by-Month Guide

    What are the Biggest Events in Cape Town in 2027? The Month-by-Month Guide

    Jan Feb Mar Apr May Jun Jul Aug Sep Oct Nov Dec Stormers Jan run Stormers Jan run Two Oceans Two Oceans Marathon · first Major Marathon · first Major Gun Run Gun Run HSBC SVNS HSBC SVNS SA20 (final 21 Feb) SA20 (final 21 Feb) Cricket World Cup · Newlands Cricket World Cup · Newlands Cycle Tour Cycle Tour Cape Epic Cape Epic Sport Jazz Festival month Jazz Festival month Kirstenbosch season Kirstenbosch season Ultra SA Ultra SA Music Mining Indaba Mining Indaba WTM Africa WTM Africa Business Art Fair Art Fair Woordfees Woordfees Art Encounters Encounters Silwerskermfees Silwerskermfees Film Kaapse Klopse Kaapse Klopse Carnival Carnival Cape Town Pride Cape Town Pride V&A New Year's Eve V&A New Year's Eve Community

    Source: What are the Biggest Events in Cape Town in 2027? The Month-by-Month Guide · Updated 15 Oct 2026

    Read the story ↗
  • From our stories Is there a water shortage in Cape Town? October 2026 update

    Is there a water shortage in Cape Town? October 2026 update

    Early Drought Caution 20% 40% 60% 80% 100% 80% needed by end of October Nov 2024 Feb May Aug Nov 2025 Feb May Aug Oct 2025 peak · 92.6% 13 Apr 2026 · 44.8% lowest since 2018 May storm +20 points in a week 24 Jul · 78.6% 14 Oct · 74.7%

    Source: City of Cape Town weekly dam readings · Updated 15 Oct 2026

    Read the story ↗
  • From our stories When does the sea glow blue in Cape Town? Bioluminescence dates and data

    When does the sea glow blue in Cape Town? Bioluminescence dates and data

    January to April, the classic warm and calm window Jan Feb Mar Apr May Jun Jul Aug Sep Oct Nov Dec 2023 2024 2025 2026 Only events with a published date are plotted. Social-media-only reports are excluded except where noted.

    Source: GroundUp and News24 (January 2024); Cape {town} Etc (November 2023); Jacaranda FM (August 2025); 2oceansvibe (October 2… · Updated 9 Oct 2026

    Read the story ↗
Article of the day

Stories about Cape Town

See all articles →
Cape Town food

What Cape Town cooks and eats

Read about the food people in Cape Town cook at home, buy on the street and make for Eid, Good Friday and the braai, and where it all comes from.

All Cape Town dishes
Discover people

The people shaping South Africa

Image credits
See all people →
Crime and safety

Is your area safe?

Plain answers from the police's own figures for each part of Cape Town: what kind of crime, how it compares with the whole city, and whether it is getting better.

Find your area →

Source: SAPS quarterly crime statistics and Census 2022

Culture Spotlight

South African Music

Amapiano, Cape Jazz, Kwaito and other South African sounds.

Cape Town Explained

Did you know?

Cape Town Explained →
New · Data Stories

Cape Town's stories in data

Follow wildfires, water, load shedding, crime, the cost of living and transport in Cape Town as they change over time.

Follow a thread

Stories we are following

Live
Wind & Beach

Which beach is sheltered right now? Check live wind readings for the peninsula's beaches.

Check today
Stage 0
Load shedding

Current stage, schedules, and historical trends for Cape Town and other SA cities.

View
116 Wards
Crime & Safety Map

A free safety index for every ward in the city, researched by our editors from the listed sources. It is separate from the source-linked district crime reports and official SAPS station counts.

73.0% Full
Dam Levels

Track water levels across Cape Town's six major dams with weekly trends.

View
Typical
Airport Commute
To Airport 15–15 min
Usually quick
To City 17–17 min
Usually quick

N2 Highway · Typical for this hour, from 21 days of readings

Market Data
Housing Insights

Property market data for Cape Town. Inflation-adjusted prices and trends.

View
Recorded AIS
Ship Traffic

Ships rounding the Cape of Good Hope over one recorded day, 23 to 24 August 2026, replayed from AIS signals. Cape route traffic has nearly doubled since ships began avoiding the Red Sea.

Interactive
Travel Quiz

Take the quiz to find a Cape Town neighbourhood that suits you.

Take Quiz
14 Datasets
Data Portal

Every Cape Town dataset we publish: energy, water, safety, nature and more.

Explore All

The brief, every two weeks

Cape Town, in numbers, every two weeks

Cape Town updates in your inbox every two weeks: safety, dams, rainfall and new guides. Includes a free member account.

Share chart