Politics · Chart
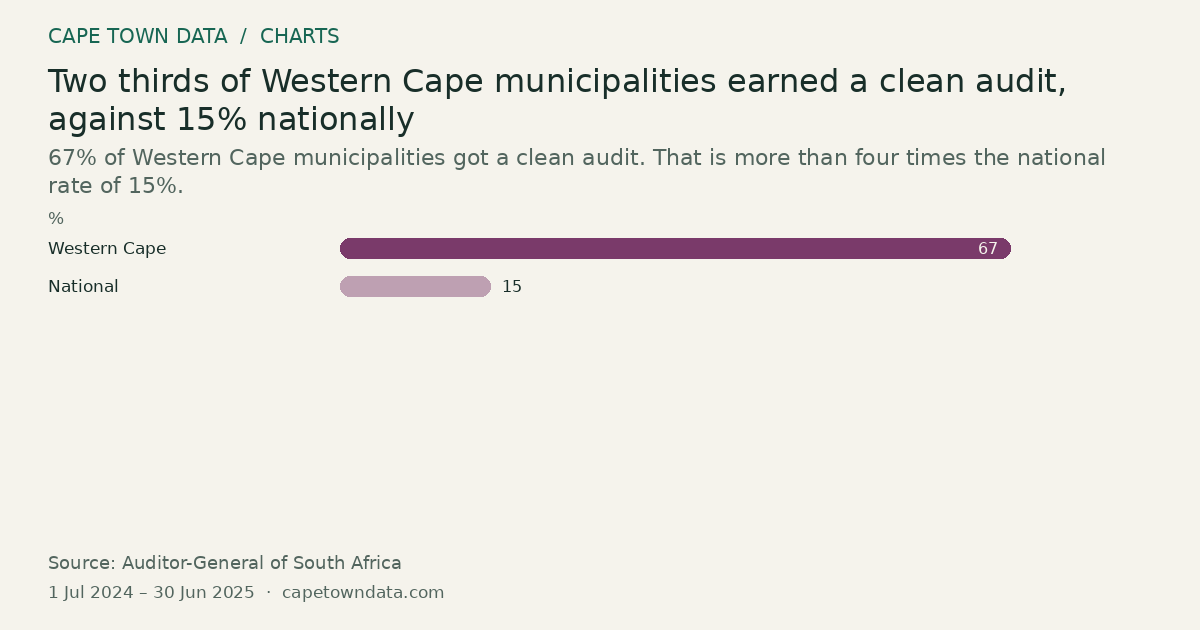
Two thirds of Western Cape municipalities earned a clean audit, against 15% nationally
67% Western Cape · Highest
67% of Western Cape municipalities got a clean audit. That is more than four times the national rate of 15%.
 From our storiesHow well has he Democratic Alliance ruled Cape Town? Here is what the data showsRead the full story →
Method and sources
Each bar is the share of municipalities that earned a clean audit in the 2024/25 local government audit outcomes, as reported in the article.
Western Cape 67%, which the article explains as 20 clean audits among 30 municipalities. National 15%.
The article gives the audit year as 2024/25 without exact dates, so the period is approximated as the municipal financial year, 1 July 2024 to 30 June 2025.
Sources: Auditor-General of South Africa (https://www.agsa.co.za/)
Figures as published in our article on the DA's record in Cape Town (chart last checked 14 September 2026): Auditor-General of South Africa local government audit outcomes for 2024/25. The link is to the publisher, not the exact table.
Chart updated · 30 Oct 2026. The observation dates above describe the data, not today’s conditions.
Related charts
The EFF’s share of the national vote rose until 2019, then fell
10.8% 2019 · Highest
Select a bar to inspect its value.
The party rose fast, peaked in 2019, and fell for the first time in 2024.
Source: Electoral Commission of South Africa (IEC) and IPU Parline · All bars start at zero
The ANC's national vote fell from 69.7% to 40.2% in twenty years
69.7% 2004 · Highest
Select a bar to inspect its value.
The party’s support had been falling for years. In 2024 it dropped below 50% for the first time and had to form a coalition government.
Source: Electoral Commission of South Africa (IEC) · All bars start at zero
The DA holds 24 of the Western Cape's 42 seats, a majority on its own
24seats DA · Highest
Select a bar to inspect its value.
A party needs 22 seats for a majority. The DA won 24 on its own, and the remaining seats are split between eight parties.
Source: Electoral Commission of South Africa (IEC) · All bars start at zero