Politics · Chart
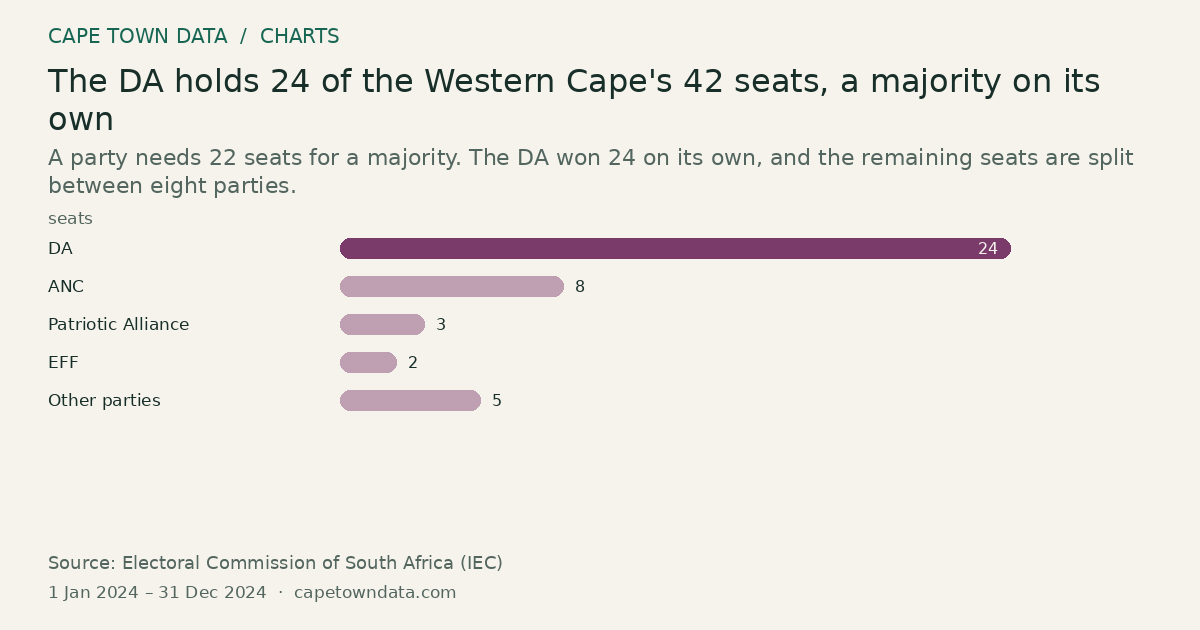
The DA holds 24 of the Western Cape's 42 seats, a majority on its own
24seats DA · Highest
A party needs 22 seats for a majority. The DA won 24 on its own, and the remaining seats are split between eight parties.
 From our storiesHow well has he Democratic Alliance ruled Cape Town? Here is what the data showsRead the full story →
Method and sources
Each bar is the number of seats a party won in the 42-seat Western Cape Provincial Parliament at the 2024 provincial election, as reported in the article. A majority needs 22 seats.
DA 24, ANC 8, Patriotic Alliance 3, EFF 2, other parties 5. The article labels the last group Others and lists it as the FF Plus, ACDP, GOOD, NCC and Al Jama-ah with one seat each.
The article gives the election year only and no polling date, so the period is approximated as 1 January 2024 to 31 December 2024.
Sources: Electoral Commission of South Africa (https://www.elections.org.za/)
Figures as published in our article on the DA's record in Cape Town (chart last checked 14 September 2026): IEC 2024 Western Cape provincial election result. The link is to the publisher, not the exact table.
Chart updated · 14 Sep 2026. The observation dates above describe the data, not today’s conditions.
Related charts
The EFF’s share of the national vote rose until 2019, then fell
10.8% 2019 · Highest
Select a bar to inspect its value.
The party rose fast, peaked in 2019, and fell for the first time in 2024.
Source: Electoral Commission of South Africa (IEC) and IPU Parline · All bars start at zero
The ANC's national vote fell from 69.7% to 40.2% in twenty years
69.7% 2004 · Highest
Select a bar to inspect its value.
The party’s support had been falling for years. In 2024 it dropped below 50% for the first time and had to form a coalition government.
Source: Electoral Commission of South Africa (IEC) · All bars start at zero
Two thirds of Western Cape municipalities earned a clean audit, against 15% nationally
67% Western Cape · Highest
Select a bar to inspect its value.
67% of Western Cape municipalities got a clean audit. That is more than four times the national rate of 15%.
Source: Auditor-General of South Africa · All bars start at zero