Energy · Chart
Planned data centres would need a third as much power as the whole of Cape Town at its peak
1,096MW All other Cape Town demand · Highest
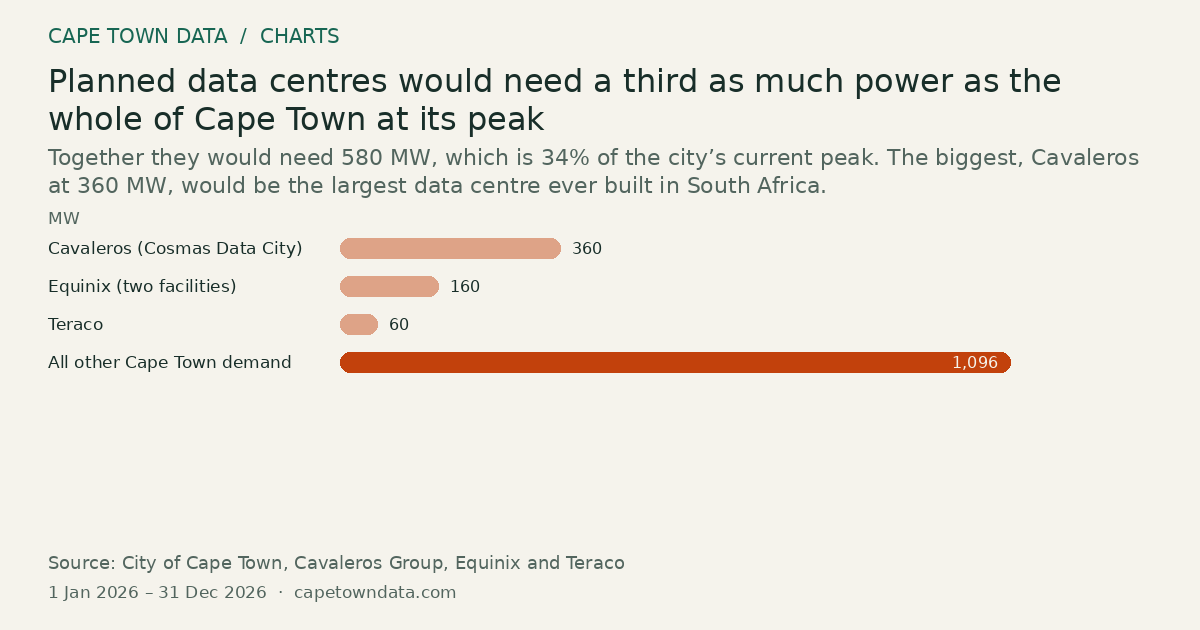
Together they would need 580 MW, which is 34% of the city’s current peak. The biggest, Cavaleros at 360 MW, would be the largest data centre ever built in South Africa.
 From our storiesHow much energy do Cape Town's data centres need?Read the full story →
Method and sources
Each bar is a component of Cape Town's current peak electricity demand of 1,676 MW, in megawatts, as printed in the article's chart. The first three bars are announced data centre demand; the fourth is the rest of the city's load.
Cavaleros (Cosmas Data City): 360 MW.
Equinix, two facilities of 80 MW each: 160 MW.
Teraco: 60 MW.
All other Cape Town demand: about 1,096 MW.
The three data centre bars sum to the 580 MW pipeline the article describes, which is 34% of the 1,676 MW peak. The article gives no exact dates, so the period is the 2026 calendar year.
Sources: City of Cape Town (https://www.capetown.gov.za/) for the peak demand figure, with the capacities announced by Cavaleros Group, Equinix and Teraco. The link is to the City, not the exact table.
Figures as published in our article on data centre energy demand in Cape Town (chart last checked 14 September 2026): City of Cape Town peak demand and the operators' own announced capacities.
Chart updated · 19 Oct 2026. The observation dates above describe the data, not today’s conditions.
Related charts
Diesel went up R4.96 a litre in May 2026, petrol only R1.85
4.96R per litre Diesel 0.05% (wholesale) · Highest
Select a bar to inspect its value.
Diesel and paraffin went up about two and a half times as much as petrol. Their prices had more catching up to do, and a temporary R3.00 cut in the fuel levy applied to petrol only.
Source: Central Energy Fund · All bars start at zero