Is there a water shortage in Cape Town? Update 2026
December 2, 2025

Photo: AerialcamSA, CC BY-SA 4.0, via Wikimedia Commons
Is there a water shortage in Cape Town?
Short answer: not right now. A rare May storm pulled Cape Town's dams out of an early drought warning in a single week. The water is back, but the City says it has to last the year.
The season in one chart
Cape Town's dams fell all summer, then jumped in a week. Combined storage is now 72.3%, above the 70% line the City treats as healthy for this time of year.
The decline ran from December to late April. By 24 April the system reached about 47.3%, the lowest for that date since the 2018 crisis. Then a storm in mid-May, described by the City as a 1-in-20 to 1-in-200 year event in several catchments, raised combined storage by close to 20 percentage points between 11 and 18 May. The same storms caused severe flooding and 11 deaths, and a provincial disaster was declared. This water supplies Cape Town along with the Overberg, Boland, West Coast and Swartland.
Individual dam breakdown
Five of the six major dams are well above the same week last year. The dark marker on each bar shows last year's level for comparison.
Source: City of Cape Town daily dam reading, 29 May 2026. Change in percentage points versus the same week in 2025. Live updates: capetowndata.com/dam-levels
The gains are uneven. The smaller catchments closest to the city took the most rain. Wemmershoek filled to 96%, up about 46 points on last year. Steenbras Upper is the one dam below last year's mark, at 81% versus about 90%, but it is still high.
How much water the city uses
The City has a collective summer target of less than 975 million litres per day and a lower winter target of about 860 MLD. Daily use is now about 874 MLD. That is close to the winter target and about 100 MLD below the summer target. About 70% of the city's water is used in homes.
Demand has fallen from its summer peak. In late February the city was using 1,073 MLD. By late May it was about 874 MLD. Lower winter demand, together with the May rain, is what shifted the dam trend so quickly. Here is the path from summer peak to the May recovery:
The City still loses roughly 23% of its water to leaks and unaccounted-for use. That structural loss does not go away with a wet month.
Why did dam levels jump?
A rare May storm
In mid-May 2026 an extreme rainfall event hit the catchments. The City called it a 1-in-20 to 1-in-200 year event in several areas. Dams rose by about 20 percentage points in one week. Wemmershoek went from about 50% to 96%.
A dry lead-in
Before the storm, levels were low. The 2025 winter delivered below-average rain, and a hot, dry summer pushed demand up and dams down. By late April the system sat near 47%, the lowest for that date since the 2018 crisis.
One event, not a trend
The City warns against a false sense of security. One storm does not make a wet year. Officials want dams near 80% by November to lower the risk of restrictions in the next summer.
The long game
About 23% of water is still lost to leaks. The New Water Programme of desalination, groundwater and reuse aims to add about 300 MLD, but is years from full delivery. Climate variability is the backdrop to all of this.
What happens next?
The City has moved Cape Town out of Early Drought Caution and back to its Water-Wise phase. The system sits above the healthy line, but it is short of the level the City wants before next summer.
National water authorities typically want the system near 80% by November to lower the risk of restrictions the following summer. Cape Town is close, but the gap depends on the rest of the winter rains.
Key takeaways, May 2026
- Dams sit at 72.3%, above the 70% healthy reference line and about 13 points higher than a year ago.
- The recovery came from one extreme storm, not a wet season. The City says the water must last until the next rains.
- Authorities want the system near 80% by November to avoid restrictions in the following summer.
- Winter rains are underway. The week ahead looks drier than usual, so the next readings still matter.
- Daily use is near the winter target. Permanent water by-laws still apply.
No water restrictions are in force. The risk of June restrictions, flagged earlier in the year, has receded. The City keeps the right to act on its own assessments, and says it will watch the rest of the winter closely. As MMC Zahid Badroodien put it, the city cannot let one rainfall event create a false sense of water security.
The Day Zero crisis: what happened last time
Cape Town has been here before, and much worse. The Day Zero crisis of 2017–2018 remains one of the most dramatic urban water emergencies in modern history. Here is how it unfolded, and how the current cycle compares.
Frequently asked questions
How long will the water last?
Dams sit at 72.3%. The City says this water must last until the next rains. With winter rains underway, the position is comfortable for now. Whether it stays that way depends on how much rain falls from June to September. Authorities want the system near 80% by November.
Are we heading for another Day Zero?
No. At 72.3%, the system is far from the 13.5% level the City used as its 2018 operational trigger, and well above the roughly 21% lows of early 2018. The bigger risk now is complacency. A single wet week does not guarantee a wet year.
When will water restrictions start?
No restrictions are in force, and the early-2026 risk of June restrictions has receded. The City has lifted its Early Drought Caution. Restrictions are unlikely in the near term, but the City will keep watching toward the 80%-by-November benchmark.
What does this mean for residents?
Permanent water by-laws still apply, as they do at all times. There are no extra restrictions. The City still asks residents to use water carefully, because the recovery rests on one rare storm rather than a wet season.
What does this mean for tourists?
Cape Town is a safe and fully functional destination. Be mindful of water use in accommodation, as you would in any water-conscious city. There are no restrictions affecting visitors.
What does this mean for property owners?
Water security still affects property values in Cape Town over the long run. Homes with boreholes, rainwater harvesting or greywater recycling can command a premium. If restrictions ever return, properties without alternative water sources would face higher running costs.
Molteno Reservoir vulnerability
One piece of infrastructure remains a weak point regardless of dam levels: the Molteno Reservoir in Oranjezicht. In December 2025, the City issued urgent warnings as this historic service reservoir, which feeds the City Bowl and Atlantic Seaboard, was strained by peak-hour consumption.
The Molteno issue is a distribution problem, not a bulk-supply failure. When residents draw water faster than the trunk mains can refill the reservoir, pressure drops and air can enter the system, causing localised outages. Mechanical failures at pumps and valves in May 2025 also left the system more vulnerable.
Higher dam levels do not remove this risk. The reservoir is most strained during summer peak demand, so the pressure eases in winter. The City still flags supply disruptions in parts of the metro from time to time, and any sharp local demand spike can overwhelm the Molteno system.
Areas most vulnerable to pressure drops
These suburbs are served by the Molteno Reservoir system and are most at risk of localised supply disruptions during periods of high demand.
Map: distribution vulnerability zone
Molteno Reservoir and surrounding City Bowl and Atlantic Seaboard suburbs
Stay water-wise: what you can do right now
💧 The caution is lifted, but the City still asks everyone to save water
- Short showers: 2 minutes max. Use the stop-and-start method, wet, lather, rinse.
- No daytime hosepipes: Do not water gardens or wash cars with municipal water during the day. Water before 09:00 or after 18:00.
- Pools: Use a cover to cut evaporation, and avoid manual or automatic top-ups where you can.
- Fix leaks: A dripping tap can waste 30+ litres per day. Report burst pipes on 0860 103 089.
- Full loads only: Run washing machines and dishwashers only when full.
- Peak hours: Avoid heavy water use between 17:00 and 21:00.
Standing water by-laws apply in Cape Town at all times, even with the drought caution lifted. Full regulations are on the City of Cape Town's ThinkWater website.
For visitors: Cape Town is a fully functional city with reliable tap water. Being water-conscious in hotels, guesthouses and holiday rentals is appreciated and expected.
📊 Track dam levels, updated weekly
Monitor all six major dams, consumption data and the City's status in one place.
View live dam levelsYou May Also Like

Where Are South Africans Emigrating? Data-Driven Analysis 2026
Photo courtesy of Nic0, Wikimedia Commons, licensed under CC BY-SA 3.0 Global Diaspora · Migration Data Analysis · South Africa 2026 Where Are South Africans…
Read Article
What Is South Africa's New Traveller Declaration?
Travel Guide · South Africa What Is South Africa's New Traveller Declaration? From today, 1 July 2026, everyone who enters or leaves South Africa has…
Read Article
How Bad Were the June 30 Marches? Cape Town and South Africa 2026
Aftermath · 1 July 2026 How Bad Were the June 30 Marches? For weeks South Africa braced for another 2008. On the day itself, the…
Read Article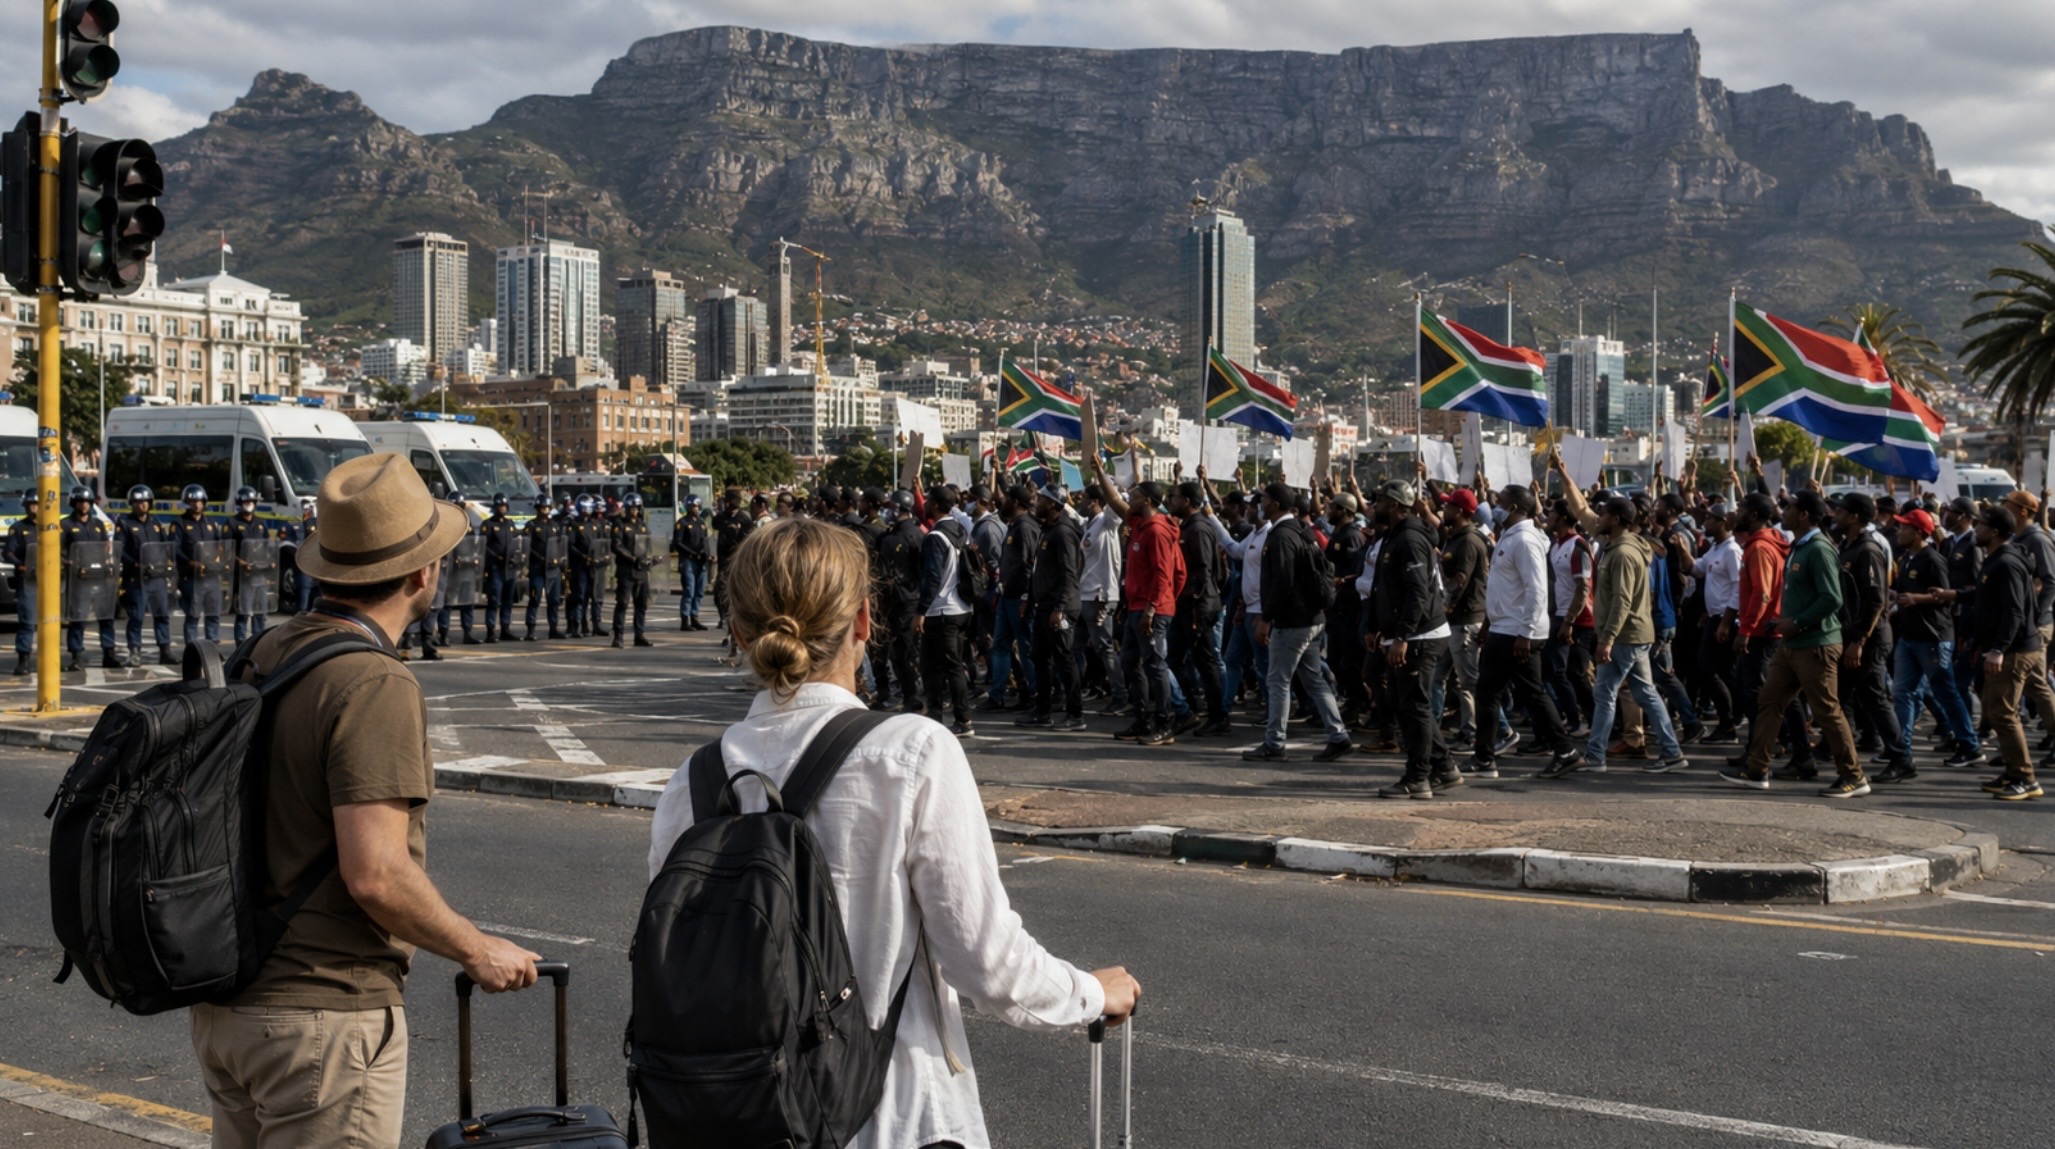
Cape Town and the June 30 Anti-Immigration Marches: What Is Happening
Situation Briefing · Cape Town The June 30 Anti-Immigration Marches: What Is Happening, and What Visitors Should Know Anti-immigration groups have set 30 June 2026…
Read Article
Is Cape Town's container port really bad?
Hero image: the working harbour at the Port of Cape Town · Frans-Banja Mulder, CC BY 3.0 , via Wikimedia Commons Editorial feature · capetowndata.com…
Read Article