Where Are South Africans Emigrating? Data-Driven Analysis 2026
July 3, 2026
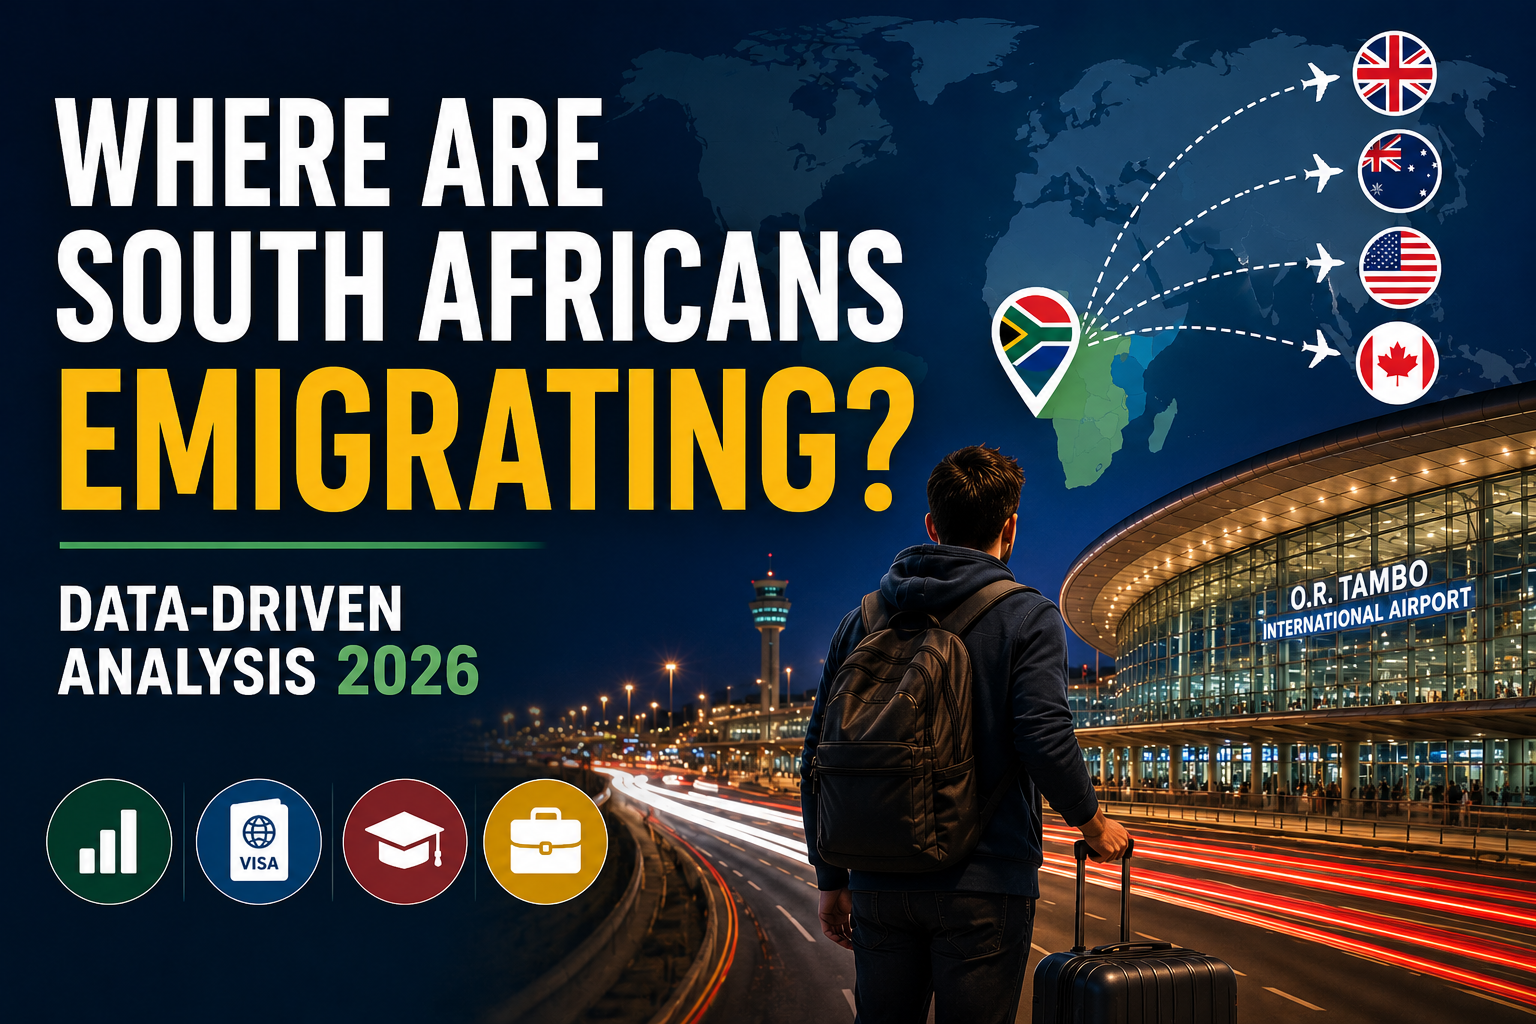

Where Are South Africans Emigrating? The Data-Driven Analysis
Over 1 million South Africans live abroad. This analysis examines where they go, why they leave, which sectors lose talent fastest, and which visa pathways actually work—supported by crime statistics, employment data, and real immigration policy.
Core statistics: 1.0–1.2 million South Africans live outside the country (UN 2024). Over 27% of adult South Africans have considered emigrating, rising to 38% among university-educated and 42% among the economically well-off. The top four push factors are: crime (64.4 per 100,000 people), unemployment (32%+), energy instability, and extreme inequality. Destination choice is not random—it is determined by visa accessibility, diaspora networks, and salaries. The UK dominates (217,000+ residents) because of the UK Ancestry Visa, which requires only a British grandparent, not a job offer or high qualification threshold. Australia attracts skilled workers (189,000+) through competitive points-based migration. Canada, despite aggressive recruitment, has only 22,000 South Africans—revealing a critical gap between recruitment messaging and actual accessibility.
In This Analysis
The Diaspora: Where South Africans Have Settled
The first chart shows the absolute size of South Africa's diaspora by destination. The UK leads with 217,000+, followed by Australia with 189,000. But raw numbers hide important patterns. The UK's lead is driven entirely by visa accessibility, not destination preference. Australia's growth is accelerating precisely because skilled workers find the points-based system transparent and achievable.
SA Diaspora: Stock of Residents by Destination (Absolute Numbers)
Most recent census/survey data: UK (2021), Australia (2021), USA (ACS 2021), rest (estimates 2024)
Why They Leave: The Four Documented Drivers
Afrobarometer's December 2024 survey of 1,582 South African adults and multiple cross-referenced sources consistently identify the same four push factors. These are not pull factors (attraction abroad) but rather structural problems at home that make leaving rational.
Crime & Safety
64.4 violent crimes per 100,000 people. SA ranks 3rd globally. For context: UK 5.5, Australia 7.2, Canada 6.5. Security costs are embedded in CoL — alarms, fencing, armed response, private schools. Yet crime persists despite investment.
Unemployment & Economy
32–33% official unemployment, 57%+ youth. Entry-level wage: R27.58/hr (≈$1.45 USD). Skilled workers see better ROI abroad. Corruption, ESKOM failures, and business volatility deter investment.
Energy & Infrastructure Collapse
215 days lost to load-shedding in 2023. Improving (300+ no-shed days by late 2025) but uncertainty persists. Manufacturing, hospitals, water treatment depend on stable power. Lack of infrastructure reliability discourages capital investment.
Inequality & Public Services
SA is the most unequal country on Earth. Public services (health, education, water) are failing. Middle/upper classes rely on private systems—expensive indefinitely. Prospect of maintaining expensive private alternatives motivates relocation.
Who Is Leaving: A Selective Exodus of Human Capital
Emigration is not uniform across the population. It is concentrated among the most educated, wealthiest, and youngest. This is a positive selection migration pattern—the economy is losing exactly the people it needs most.
Education Level vs Emigration Intent
The chart below shows the stark gradient: emigration consideration rises sharply with education. At primary school level, only 10% have considered leaving. By university level, 38% have. This is the clearest evidence of selective emigration: South Africa is losing its most educated citizens fastest.
Education Level & Emigration Intent (%)
Afrobarometer 2024 survey: proportion within each education cohort that has considered emigrating
The Destination Choice: Geography, Policy, and Networks
Where South Africans emigrate is driven by three factors: (1) visa accessibility, (2) diaspora networks (friends and family already there), and (3) salaries/career prospects. Destination choice is NOT random preference but rather constrained by immigration policy.
Visa Accessibility: The Hidden Gatekeeper
The UK's lead (217K vs Australia's 189K) is entirely explained by the UK Ancestry Visa: no job offer needed, no points test, no salary threshold. If a South African has a British grandparent (estimated 35–45% of the population), they can apply. Processing: 3 weeks. Canada, despite aggressive recruitment of skilled workers, has only 22K South Africans—not because Canada is undesirable but because the points system is high-barrier, requiring either elite credentials or pre-negotiated provincial sponsorship.
Sectoral Distribution & Skilled Migration
The exodus is concentrated in knowledge-intensive sectors. Afrobarometer and BusinessTech data show the largest outflows in: healthcare (nurses, doctors), IT/software development, engineering, education, and aviation. These are exactly the sectors SA most needs for development.
Remittances: A Surprisingly Muted Return Flow
One question this data raises but rarely gets asked directly: does the diaspora send money home? The answer complicates the simple "brain drain" narrative. South Africa received roughly $855 million in formal personal remittances in 2024, up modestly from $803 million in 2023 (World Bank data). That is a small figure set against the size of its diaspora—for comparison, Kenya, with a diaspora of similar order of magnitude, received $4.8 billion in 2024. More strikingly, South Africa is itself a net exporter of remittances within Africa: money flowing out to Zimbabwean, Mozambican, Malawian, and Lesotho nationals working inside South Africa exceeds what its own emigrants send back from abroad.
Visa Routes: Difficulty, Cost & Speed Matrix
Not all visa routes are equal. The chart below plots visa pathways by two critical dimensions: processing speed (x-axis) and accessibility (y-axis, measured inversely as difficulty). This reveals why certain destinations have vastly different South African populations despite similar career prospects.
Visa Complexity vs Speed: Where SA Emigration Pathways Cluster
X-axis: processing time (months) · Y-axis: accessibility barrier (1=low, 10=high) · bubble size = SA population in destination (√-scaled, so area is proportional to population)
The Smaller Destinations: UAE, Germany, Singapore
The diaspora chart above also shows three smaller but growing destinations that don't fit neatly on the ancestry-versus-skilled axis of the main pathways: the UAE, Germany, and Singapore. Each runs on a different logic.
Employer-Sponsored, Tax-Free
No points system. Most South Africans arrive on an employer-sponsored work visa tied to a UAE company; the employer handles the application. Personal income tax is 0%, a major draw for skilled professionals. High earners can bypass sponsorship entirely via the 10-year Golden Visa—either AED 30,000+/month (≈R150,000) in an approved skilled category (engineering, medicine, IT, law) with a bachelor's degree, or a AED 2 million (≈R9.8 million) property or business investment.
EU Blue Card
Requires a recognised university degree and a qualifying job offer. As of 2026, the minimum gross salary is €50,700/year (≈R1.02 million) for standard roles, or €45,934/year (≈R925,000) for shortage occupations—which explicitly include IT, engineering, and healthcare, the same fields dominating South Africa's skills exodus. No German language requirement to apply. Fastest route to EU permanent residence of any option covered in this analysis: as little as 21 months with basic German.
Employment Pass + COMPASS
Employer-sponsored, points-scored. From 2026, a minimum salary of S$5,600/month (≈R83,000) for most sectors, rising with age and seniority, plus a COMPASS points test (qualifications, salary competitiveness, workforce diversity, local hiring support). No ancestry or investment shortcut. Popular with SA finance and tech professionals but the smallest of the three destinations by population.
What Links Them
All three are pure skilled-labour markets with no ancestry or Commonwealth advantage for South Africans—unlike the UK or, to a lesser extent, Australia and New Zealand. That makes them a genuine alternative for skilled professionals who lack a British grandparent, but the bar is a real salary and a real employer, not a points calculator alone.
A New Pathway: The US Refugee Program for Afrikaners
The chart above covers standard immigration channels—it does not include one of the most consequential and controversial developments in South African emigration policy since 2025: a US refugee resettlement pathway created specifically for Afrikaners. It is excluded from the scatter plot deliberately, because it is not a skilled-migration or ancestry route at all—it is a refugee/humanitarian admission, a fundamentally different legal category with its own cap, criteria, and controversy.
On 7 February 2025, President Trump signed Executive Order 14204, "Addressing Egregious Actions of the Republic of South Africa," which cut US aid to South Africa and directed the State Department and Department of Homeland Security to prioritise refugee resettlement for Afrikaners "escaping government-sponsored race-based discrimination, including racially discriminatory property confiscation." The order cited South Africa's Expropriation Act 13 of 2024 and South Africa's genocide case against Israel at the International Court of Justice as justification. The first group of 59 arrived at Dulles International Airport, Virginia, on 12 May 2025.
Eligibility & How It Works
Per the US Embassy in Pretoria, applicants must: be South African nationals; be of Afrikaner ethnicity or a member of a racial minority in South Africa; be able to articulate a past experience of, or well-founded fear of, persecution on account of race, religion, nationality, social group, or political opinion; and be 18 or older (or referred alongside a parent). Applications and interviews happen while applicants are still inside South Africa and are processed through RSC Africa, operated by Church World Service—the sole authorised implementing partner. This is itself unusual: the 1951 Refugee Convention definition normally requires an applicant to already be outside their country of origin, and most refugees historically waited years in third-country camps before a US decision. This program compresses that into months and processes people who have never left home.
By March 2025 the US Embassy reported roughly 8,000 inquiries; later estimates put total expressions of interest at over 67,000. Most arrivals have settled in Texas (roughly 770–800), followed by Florida and California (around 450 each). In September 2025 the administration set the FY2026 refugee ceiling at 7,500—the lowest total US refugee cap since the modern program began in 1980—with Afrikaners as the only population specifically named as a priority group. In May 2026, officials proposed raising the cap by a further 10,000 (to 17,500) for the remainder of the fiscal year, citing an "emergency refugee situation," at an estimated cost of $100 million.
For the purposes of this analysis, the program is best understood as a distinct, politically-driven channel running parallel to—not replacing—the conventional US employment-based route covered in the chart above. At roughly 6,000–7,500 admissions per year it is larger in annual flow than Canada's entire documented SA-born population, but its long-term durability is untested: it depends on a single executive order, has no UNHCR backing, and its criteria and cap could change with any change in US administration or policy.
Which Sectors Lose Talent Fastest
South Africa's brain drain is not evenly distributed. Certain sectors lose skilled workers at alarming rates. The chart below shows the sectors with the largest emigration of South African professionals (2015–2026).
Skills Exodus by Sector: Annual Emigration 2015–2026
Estimated annual outflow of South African professionals by sector (BusinessTech, FinGlobal 2024 analysis)
Visa Policy Changes & Timeline: A Shrinking Window
Emigration pathways are not static. Recent policy changes in the UK, Australia, Canada, and now the US have reshaped South Africa's viable emigration options—in the US case, opening an entirely new and unusual channel.
From £776 to £1,035 per year for most visa categories. Ancestry visa IHS: £624/yr × 5 years = £3,120 total. This increased the true cost of the UK Ancestry Visa from ~£3,250 to ~£3,700 GBP (R68,000–R70,000).
Express Entry Comprehensive Ranking System cutoff has stabilized at 500–520 points. For most South Africans without Canadian experience, hitting this threshold requires either a job offer or provincial sponsorship. This has effectively raised the bar for applicants without pre-negotiated pathways.
President Trump signs an executive order cutting US aid to South Africa and directing agencies to prioritise Afrikaners for refugee resettlement, citing South Africa's Expropriation Act and its ICJ genocide case against Israel. This runs alongside a separate order that had already suspended the broader US refugee program worldwide.
UK immigration white paper hints at extending Indefinite Leave to Remain (ILR) qualifying period from 5 to 10 years for some visa categories. Impact on Ancestry visas unclear, but messaging already discouraging applications. Processing still happens at standard 3 weeks, but long-term settlement timeline now uncertain.
59 South Africans land at Dulles International Airport, Virginia, welcomed by Deputy Secretary of State Christopher Landau. By March 2025 the US Embassy had logged roughly 8,000 inquiries; estimates later put total interest above 67,000.
The lowest total US refugee ceiling since the modern program began in 1980, down from 125,000 the previous year. Afrikaners are the only population specifically named as a priority group; by mid-2026 they account for roughly 99% of all US refugee admissions.
With arrivals nearing the 7,500 ceiling, the administration proposes adding 10,000 additional slots for the remainder of FY2026, citing an "emergency refugee situation," at an estimated cost of $100 million. The South African government continues to reject the discrimination premise underlying the program.
Australia's points-based system remains transparent and achievable for skilled workers. Points threshold: 65–75 depending on occupation demand. Processing: 8–12 months. Australia has maintained consistent messaging to skilled migrants, making it the most predictable option despite longer processing times.
Frequently Asked Questions
Is 1 million South Africans abroad confirmed or an estimate?
The UN Migrant Stock report (2024 update) put the figure at 900,000+ as of 2020. Stats SA's mid-year population estimates (2025) show white South African emigration alone at ~95,000 annually (2021–2026), and emigration across all population groups is likely 120,000+/yr. By 2026, the total is plausibly 1.0–1.2 million. This is the most credible estimate, though exact figures are difficult given undocumented/return migration. UN estimates are conservative.
Why is the UK's Ancestry Visa so dominant if salaries are lower?
Three reasons: (1) Accessibility: millions of South Africans have British grandparents; (2) Speed: 3 weeks vs 12+ months elsewhere; (3) Certainty: no points test, no occupation list, no quota. South Africans choose the fastest exit, then optimize within destination. The UK also attracts family reunification migration—people whose relatives already settled there.
Do South Africans return home? Is emigration permanent?
Return migration is rare. Afrobarometer found that 67% of students aspire to work abroad for experience, and 67% hope eventually to contribute to SA. But once abroad, few return. Reasons: (1) family networks built quickly; (2) children born abroad have foreign citizenship; (3) cost of returning (selling UK property, re-establishing networks) is high; (4) security concerns deter re-commitment to SA. One study suggested <5% of SA emigrants return permanently within a 5-year window.
What percentage of South Africans can actually emigrate?
Estimated 8–15% have realistic pathways to developed countries: (a) ~5–8% have British grandparents (UK route); (b) ~2–5% are tertiary-educated in demand occupations (Australia/NZ); (c) <1% have capital for golden visas (€280K+) or family sponsorship already abroad. The remaining 85%+ lack viable routes. Emigration is a privilege of the educated and genealogically fortunate.
Is SA's problem a "brain drain" or normal emigration?
Both. Emigration is normal. But SA's is disproportionately concentrated among the most educated (38% vs ~10% for primary education) and is accelerating. The departure rate of skilled workers, especially from healthcare and IT, exceeds similar-income countries. That is brain drain. Whether it is recoverable depends on whether SA can build conditions attractive to returning or immigrating talent—which requires fixing crime, energy, unemployment, and inequality.
What is the new US refugee program for Afrikaners, and can most South Africans use it?
No—it is not a general emigration route. Following Executive Order 14204 (7 February 2025), the US created a refugee pathway specifically for Afrikaners and other South African racial minorities who can demonstrate past or feared persecution. It runs under a strict annual cap (7,500 for FY2026, with a proposed increase to 17,500), processes applicants while they are still in South Africa through a single authorised partner (RSC Africa), and has admitted roughly 6,000–6,500 people in its first full fiscal year. The UNHCR has not endorsed the underlying persecution claims and has no role in vetting; South Africa's government disputes the premise outright; and several Afrikaner advocacy groups in South Africa have themselves publicly rejected the "genocide" framing used to justify it. Some early arrivals have already returned home. It is best understood as a narrow, politically contingent channel—not a scalable alternative to the UK, Australian, or Canadian routes covered above.
Sources & Data References
International Data & UN Statistics
UN Department of Economic and Social Affairs: International Migration Stock 2024 · MacroTrends: South Africa Net Migration Historical Data
South African Government & Statistics Authority
Statistics South Africa: Migration Profile Report & Mid-Year Population Estimates 2025 · Stats SA Labour Force Survey & Employment Data
Academic & Research Organizations
Afrobarometer Dispatch No. 914: South Africans Thinking About Emigration (December 2024) · BusinessTech: South African Brain Drain Analysis (2024) · FinGlobal: Impact of Emigration on Skills Shortage in South Africa (February 2024)
Immigration & Visa Policy
UK Visas & Immigration: Visa Processing Times (February 2025) · Australian Department of Home Affairs: Skilled Migration & Visa Information · Immigration, Refugees and Citizenship Canada: Express Entry
US Afrikaner Refugee Program
US Embassy & Consulates in South Africa: Refugee Admissions Program Criteria · Wikipedia: White South African Refugee Program (sourced timeline & figures) · PassBlue: Admissions Data & Program Analysis (May 2026) · Christian Science Monitor: FY2026 Refugee Admissions Data (April 2026) · Global Refuge: FY2026 Refugee Cap Analysis · Human Rights Watch: Analysis of Executive Order 14204
Crime & Safety Context
South African Police Service: Crime Statistics · Crime Hub South Africa: Precinct-Level Data · Spotlight NSP: Crime Analysis & Policy · Numbeo: Global Crime Rankings by Country
Economic & Employment Indicators
South African Reserve Bank: Economic Data & Reports · Eskom: Load-Shedding Status & Energy Reports · Property24: South African Property Market Data · World Bank: South Africa Personal Remittances Data
Additional Destination Visa Sources
UAE Government: Golden Visa Official Portal · EU Blue Card Germany: 2026 Salary Thresholds · Singapore Ministry of Manpower: Employment Pass Eligibility
Diaspora Data & Census
Wikipedia: South African Diaspora (Census Data UK 2021, Australia 2021, USA ACS 2021)
You May Also Like

What Is South Africa's New Traveller Declaration?
Travel Guide · South Africa What Is South Africa's New Traveller Declaration? From today, 1 July 2026, everyone who enters or leaves South Africa has…
Read Article
How Bad Were the June 30 Marches? Cape Town and South Africa 2026
Aftermath · 1 July 2026 How Bad Were the June 30 Marches? For weeks South Africa braced for another 2008. On the day itself, the…
Read Article
Cape Town and the June 30 Anti-Immigration Marches: What Is Happening
Situation Briefing · Cape Town The June 30 Anti-Immigration Marches: What Is Happening, and What Visitors Should Know Anti-immigration groups have set 30 June 2026…
Read Article
Is Cape Town's container port really bad?
Hero image: the working harbour at the Port of Cape Town · Frans-Banja Mulder, CC BY 3.0 , via Wikimedia Commons Editorial feature · capetowndata.com…
Read Article
What's up in Cape Town ? The Weekly | 1 -7 June 2026
Edition #18 · 1-7 June 2026 · Winter Settles In What's up in Cape Town? The Weekly Your guide to the Mother City The dams…
Read Article