Transport · Chart
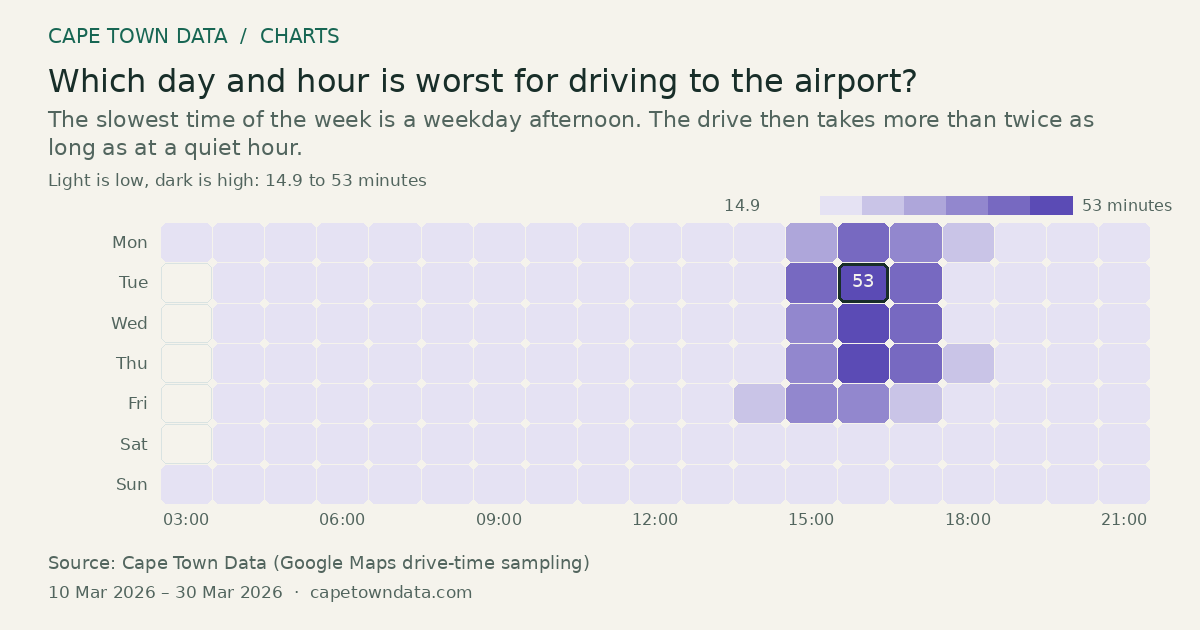
Which day and hour is worst for driving to the airport?
53minutes Tue 16:00 · Highest
The slowest time of the week is a weekday afternoon. The drive then takes more than twice as long as at a quiet hour.
Select a cell to inspect its value.
View data table
| Observation | minutes |
|---|---|
| 03:00 | 14.9 |
| 04:00 | 15.4 |
| 05:00 | 15.3 |
| 06:00 | 15.8 |
| 07:00 | 16.2 |
| 08:00 | 16.4 |
| 09:00 | 16.5 |
| 10:00 | 16.6 |
| 11:00 | 16.8 |
| 12:00 | 17.1 |
| 13:00 | 17.9 |
| 14:00 | 20.2 |
| 15:00 | 38.7 |
| 16:00 | 47.2 |
| 17:00 | 37.7 |
| 18:00 | 21 |
| 19:00 | 16.8 |
| 20:00 | 16.5 |
| 21:00 | 16.1 |
| minutes | 03:00 | 04:00 | 05:00 | 06:00 | 07:00 | 08:00 | 09:00 | 10:00 | 11:00 | 12:00 | 13:00 | 14:00 | 15:00 | 16:00 | 17:00 | 18:00 | 19:00 | 20:00 | 21:00 |
|---|---|---|---|---|---|---|---|---|---|---|---|---|---|---|---|---|---|---|---|
| Mon | 14.9 | 15.1 | 15.2 | 15.4 | 16 | 16.1 | 16.4 | 16.4 | 16.5 | 16.5 | 16.8 | 17.9 | 33.4 | 42.4 | 37.8 | 21.5 | 16.7 | 16.1 | 15.9 |
| Tue | 15.5 | 15.2 | 15.8 | 16.3 | 16.5 | 16.4 | 16.6 | 16.8 | 17 | 18.6 | 19.6 | 42.1 | 53 | 42.3 | 21 | 16.6 | 16.5 | 16.1 | |
| Wed | 15.3 | 15.3 | 15.8 | 16.2 | 16.4 | 16.3 | 16.5 | 16.8 | 17.1 | 17.2 | 18.8 | 38 | 50.4 | 41.6 | 20.7 | 16.6 | 16.6 | 16.3 | |
| Thu | 15.5 | 15.3 | 15.8 | 16.2 | 16.4 | 16.5 | 16.7 | 16.8 | 17.1 | 17.4 | 20.6 | 40.2 | 51 | 41.4 | 24.4 | 17.4 | 16.7 | 16.1 | |
| Fri | 15.4 | 15.7 | 16 | 16.3 | 16.7 | 16.7 | 16.8 | 17 | 17.7 | 19.3 | 24.3 | 39.9 | 39.1 | 25.6 | 17.3 | 16.7 | 16.6 | 16.2 | |
| Sat | 15.3 | 15.3 | 15.3 | 15.2 | 15.3 | 15.7 | 16.1 | 17.1 | 17.8 | 17.9 | 17.8 | 18.5 | 17.4 | 17.5 | 17.5 | 16.8 | 16.6 | 16.4 | |
| Sun | 14.9 | 15.3 | 15.2 | 15 | 15.1 | 15 | 15.2 | 15.6 | 15.8 | 15.9 | 15.8 | 16.4 | 16.1 | 16 | 17 | 16.7 | 18.8 | 18.8 | 16.4 |
Method and sources
One cell per weekday and hour: the average city to airport drive time across every snapshot taken in that hour on that day of the week. Times come from repeated Google Maps drive-time readings on the route, sampled across the dates shown, and include live traffic as it stood at the time of each reading. Weekends are kept here, which the hour-by-hour charts leave out. An hour the sampler did not cover on a given day is left empty rather than drawn as zero, and when the sampling covers more than twenty hours only 04:00 to 23:00 is shown. These are typical hours, not a forecast for any one trip.
Our own drive-time sampling, 2558 snapshots between 2026-03-10 and 2026-03-30.
Chart updated · 21 Sep 2026. The observation dates above describe the data, not today’s conditions.
Related charts
Cape Town International in 2025: most passengers were flying domestic
7.8million passengers Domestic · Highest
Select a bar to inspect its value.
About seven in ten of the airport's record 11.1 million passengers were on domestic flights.
Source: Airports Company South Africa (ACSA) · All bars start at zero
South Africa's festive season road deaths rose again in 2024/25
1,510deaths 2022/23 · Highest
Select a bar to inspect its value.
Deaths peaked at 1,510 in 2022/23, fell to 1,427 a year later, then rose 5.3% to 1,502 in 2024/25.
Source: Department of Transport and Road Traffic Management Corporation (RTMC) · All bars start at zero
South Africa’s aviation safety score has risen to 95.1%
95.1% ▲ +11.3 · +13.5 % · since 2013
Select a point to inspect its value.
The score has risen at every audit, from 83.8% in 2013 to 95.1% in 2026, well clear of the global average of roughly 68%.
Source: International Civil Aviation Organization (ICAO) and South African Civil Aviation Authority (SACAA) · The scale runs from 80 to 100, not from zero