Transport · Chart
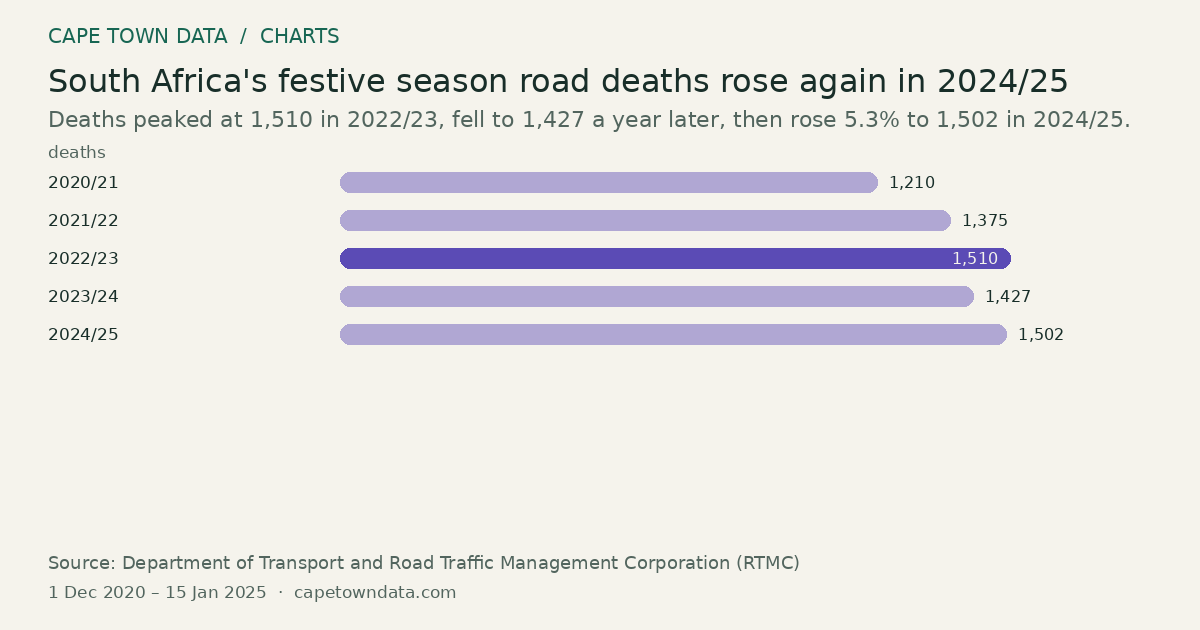
South Africa's festive season road deaths rose again in 2024/25
1,510deaths 2022/23 · Highest
Deaths peaked at 1,510 in 2022/23, fell to 1,427 a year later, then rose 5.3% to 1,502 in 2024/25.
 From our storiesSafety Tips for Driving in Cape Town and South AfricaRead the full story →
Method and sources
Each bar is the number of road deaths recorded across South Africa during one festive season, as reported in the article.
2020/21: 1,210, held down by COVID curfew restrictions.
2021/22: 1,375.
2022/23: 1,510.
2023/24: 1,427, down 5.5% on the season before.
2024/25: 1,502 deaths from 1,234 fatal crashes, up 5.3% on the season before.
The article describes the festive season as running from approximately 1 December to mid-January, so the period uses 1 December 2020 to 15 January 2025 and the end date is approximate.
Sources: Department of Transport and Road Traffic Management Corporation festive season road safety statements (https://www.gov.za and https://www.rtmc.co.za)
Figures as published in our article on driving safely in Cape Town and South Africa (last updated 30 April 2026): Department of Transport and RTMC festive season road safety statements, 2021 to 2025.
Chart updated · 14 Sep 2026. The observation dates above describe the data, not today’s conditions.
Related charts
Cape Town International in 2025: most passengers were flying domestic
7.8million passengers Domestic · Highest
Select a bar to inspect its value.
About seven in ten of the airport's record 11.1 million passengers were on domestic flights.
Source: Airports Company South Africa (ACSA) · All bars start at zero
South Africa’s aviation safety score has risen to 95.1%
95.1% ▲ +11.3 · +13.5 % · since 2013
Select a point to inspect its value.
The score has risen at every audit, from 83.8% in 2013 to 95.1% in 2026, well clear of the global average of roughly 68%.
Source: International Civil Aviation Organization (ICAO) and South African Civil Aviation Authority (SACAA) · The scale runs from 80 to 100, not from zero
When is the drive to the airport slowest?
47.2minutes 16:00 · Highest
Select a point to inspect its value.
On weekdays the drive from the city to the airport is slowest in the late afternoon.
Source: Cape Town Data (Google Maps drive-time sampling) · The scale runs from zero to 60