Transport · Chart
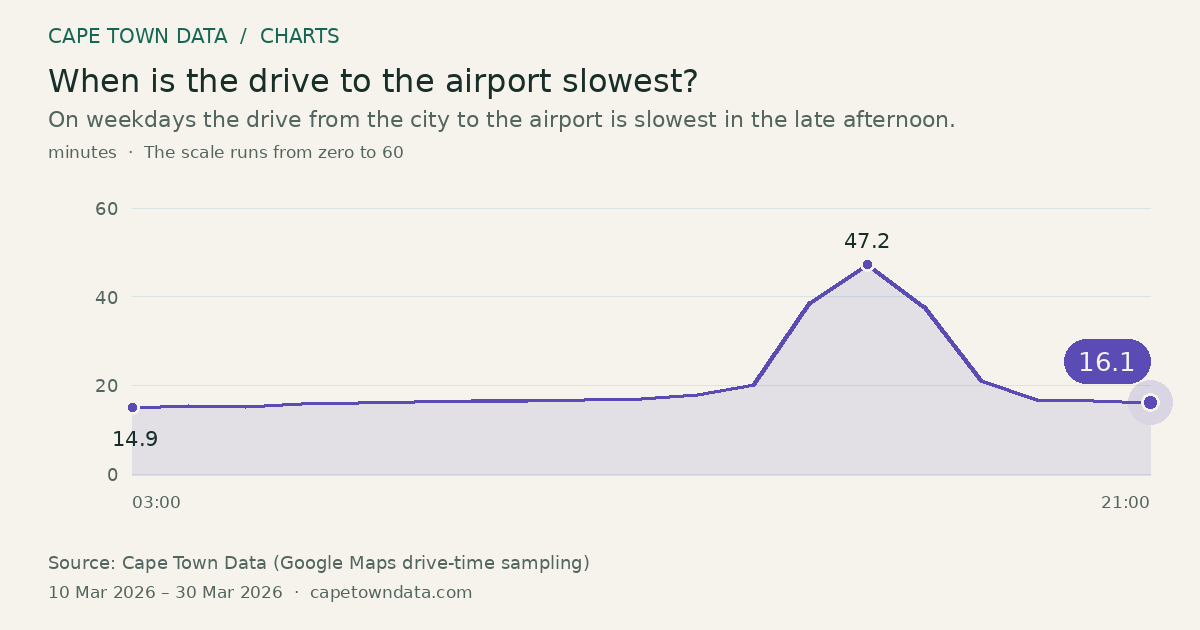
When is the drive to the airport slowest?
47.2minutes 16:00 · Highest
On weekdays the drive from the city to the airport is slowest in the late afternoon.
Select a point to inspect its value.
View data table
| Observation | minutes |
|---|---|
| 03:00 | 14.9 |
| 04:00 | 15.4 |
| 05:00 | 15.3 |
| 06:00 | 15.8 |
| 07:00 | 16.2 |
| 08:00 | 16.4 |
| 09:00 | 16.5 |
| 10:00 | 16.6 |
| 11:00 | 16.8 |
| 12:00 | 17.1 |
| 13:00 | 17.9 |
| 14:00 | 20.2 |
| 15:00 | 38.7 |
| 16:00 | 47.2 |
| 17:00 | 37.7 |
| 18:00 | 21 |
| 19:00 | 16.8 |
| 20:00 | 16.5 |
| 21:00 | 16.1 |
Method and sources
One point per hour of a working day: the average city to airport drive time across all Monday to Friday snapshots taken in that hour. Times come from repeated Google Maps drive-time readings on the route, sampled across the dates shown, and include live traffic as it stood at the time of each reading. Weekends are excluded. Hours the sampler did not cover are not drawn, and when a route covers more than twenty hours only 04:00 to 23:00 is shown. This is a typical hour, not a forecast for any one trip.
Our own drive-time sampling, 2558 snapshots between 2026-03-10 and 2026-03-30.
Chart updated · 25 Sep 2026. The observation dates above describe the data, not today’s conditions.
Related charts
Cape Town International in 2025: most passengers were flying domestic
7.8million passengers Domestic · Highest
Select a bar to inspect its value.
About seven in ten of the airport's record 11.1 million passengers were on domestic flights.
Source: Airports Company South Africa (ACSA) · All bars start at zero
South Africa's festive season road deaths rose again in 2024/25
1,510deaths 2022/23 · Highest
Select a bar to inspect its value.
Deaths peaked at 1,510 in 2022/23, fell to 1,427 a year later, then rose 5.3% to 1,502 in 2024/25.
Source: Department of Transport and Road Traffic Management Corporation (RTMC) · All bars start at zero
South Africa’s aviation safety score has risen to 95.1%
95.1% ▲ +11.3 · +13.5 % · since 2013
Select a point to inspect its value.
The score has risen at every audit, from 83.8% in 2013 to 95.1% in 2026, well clear of the global average of roughly 68%.
Source: International Civil Aviation Organization (ICAO) and South African Civil Aviation Authority (SACAA) · The scale runs from 80 to 100, not from zero