Water · Chart
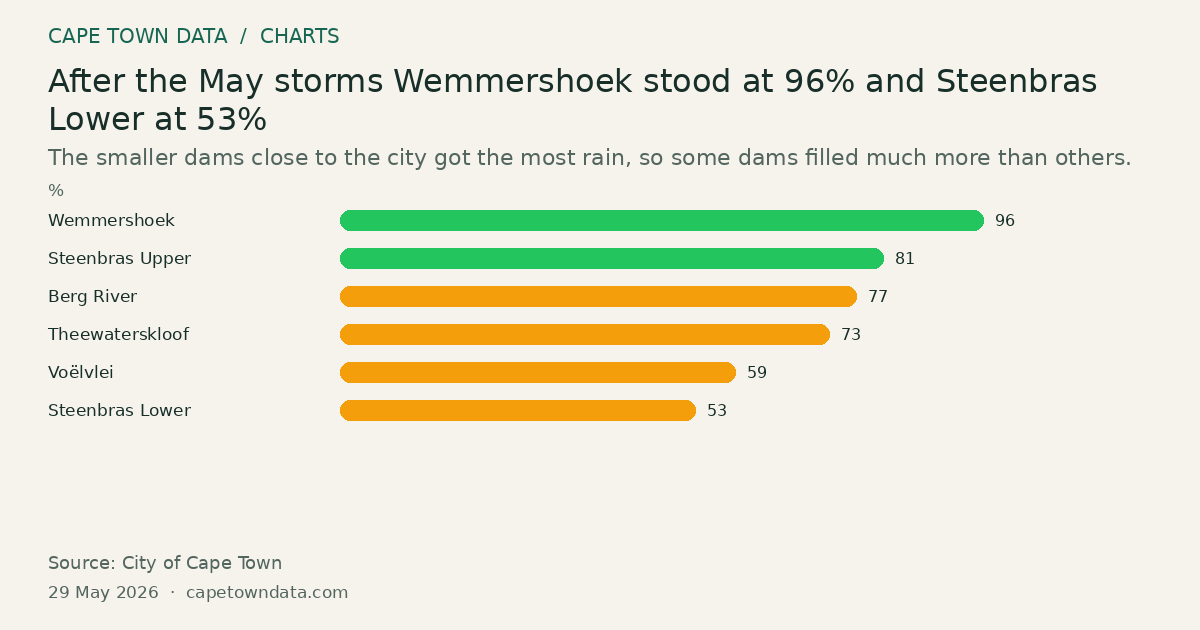
After the May storms Wemmershoek stood at 96% and Steenbras Lower at 53%
96% Wemmershoek · Highest
The smaller dams close to the city got the most rain, so some dams filled much more than others.
 From our storiesIs there a water shortage in Cape Town? October 2026 updateRead the full story →
Method and sources
Each bar is a dam's storage as a percentage of its capacity on 29 May 2026, as reported in the article. The bars are ordered from fullest to emptiest; the article lists them in system order.
Theewaterskloof 73% (up 14 points on the same week in 2025), Berg River 77% (up 14 points), Steenbras Upper 81% (down 9 points), Steenbras Lower 53% (up 13 points), Voëlvlei 59% (up 1 point), Wemmershoek 96% (up 46 points).
Combined storage across the six dams was 72.3% on the same date, against 59.2% a year earlier. Theewaterskloof holds over half of total capacity.
The reading is for a single day, so the period is that day.
Sources: City of Cape Town daily dam reading, 29 May 2026 (https://www.capetown.gov.za/)
Figures as published in our article on whether Cape Town has a water shortage (chart last checked 14 September 2026): City of Cape Town daily dam reading for 29 May 2026. Link to the publisher, not the exact table.
Chart updated · 2 Oct 2026. The observation dates above describe the data, not today’s conditions.
Related charts
How full are Cape Town’s six big dams?
100.2% Steenbras Upper · Highest
Select a bar to inspect its value.
Each bar shows how full one dam is. A small dam that is full can still hold less water than a big dam that is half empty.
Source: City of Cape Town · All bars start at zero
One dam can hold more water than the other five together
480.2million m³ Theewaterskloof · Highest
Select a bar to inspect its value.
Theewaterskloof can hold more than half of all the water Cape Town’s dams can store.
Source: City of Cape Town · All bars start at zero
Which dam holds most of Cape Town’s water?
350.5million m³ Theewaterskloof · Highest
Select a bar to inspect its value.
Theewaterskloof holds the most water, even though some smaller dams are fuller.
Source: City of Cape Town · All bars start at zero