Water · Chart
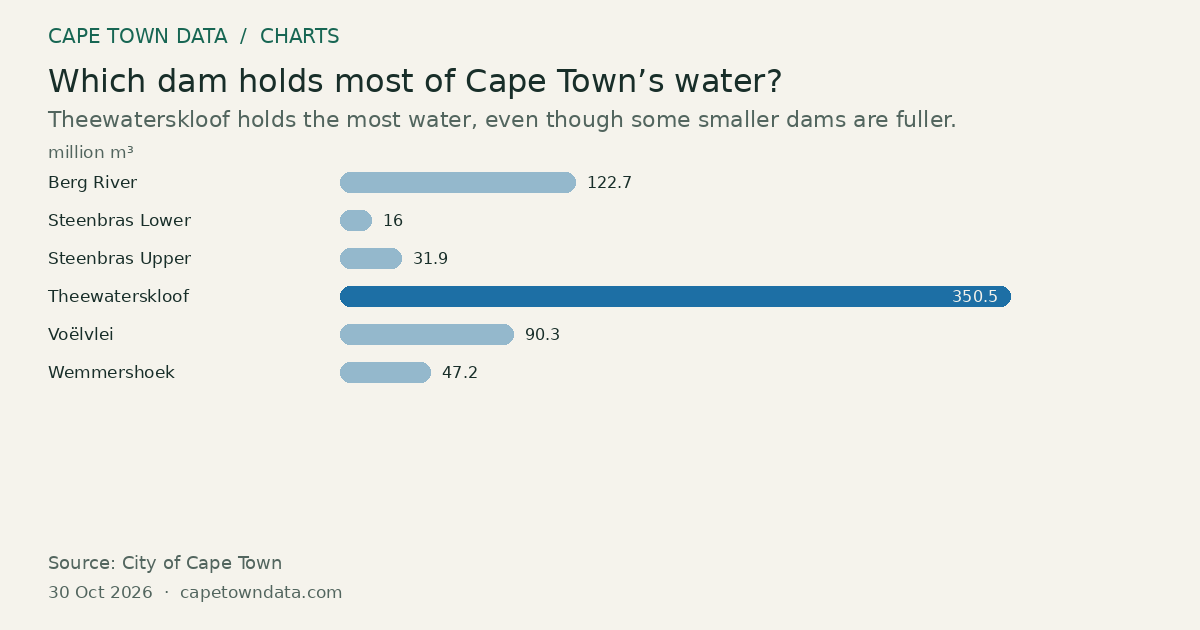
Which dam holds most of Cape Town’s water?
350.5million m³ Theewaterskloof · Highest
Theewaterskloof holds the most water, even though some smaller dams are fuller.
Method and sources
Estimated stored volume = listed capacity × percentage full / 100, rounded to one decimal. Values are derived from the same dated snapshot, not independently measured volumes.
City of Cape Town figures, reading dated 2026-10-30.
Chart updated · 31 Oct 2026. The observation dates above describe the data, not today’s conditions.
Related charts
How full are Cape Town’s six big dams?
100.2% Steenbras Upper · Highest
Select a bar to inspect its value.
Each bar shows how full one dam is. A small dam that is full can still hold less water than a big dam that is half empty.
Source: City of Cape Town · All bars start at zero
One dam can hold more water than the other five together
480.2million m³ Theewaterskloof · Highest
Select a bar to inspect its value.
Theewaterskloof can hold more than half of all the water Cape Town’s dams can store.
Source: City of Cape Town · All bars start at zero
Cape Town's dams held 48.3% in early May 2026, against 59.9% a year earlier
59.9% Same week, 2025 · Highest
Select a bar to inspect its value.
Dam levels rose by one percentage point in a week, but were still 11.6 points lower than a year earlier. The city remained on early drought caution.
Source: City of Cape Town · All bars start at zero