Share chart

← All charts

Water · Chart

One dam can hold more water than the other five together

480.2million m³ Theewaterskloof · Highest

Theewaterskloof can hold more than half of all the water Cape Town’s dams can store.
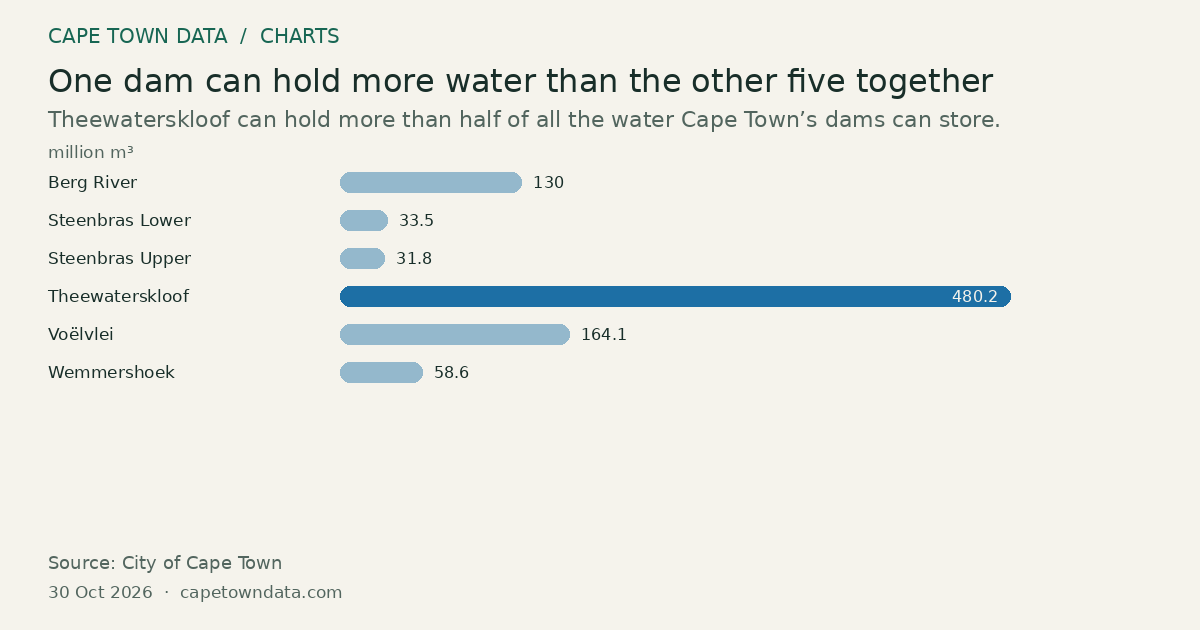
million m³ Berg River: 130 million m³ Berg River 130 Steenbras Lower: 33.5 million m³ Steenbras Lower 33.5 Steenbras Upper: 31.8 million m³ Steenbras Upper 31.8 Theewaterskloof: 480.2 million m³ Theewaterskloof 480.2 Voëlvlei: 164.1 million m³ Voëlvlei 164.1 Wemmershoek: 58.6 million m³ Wemmershoek 58.6

Select a bar to inspect its value.

View data table
Observationmillion m³
Berg River130
Steenbras Lower33.5
Steenbras Upper31.8
Theewaterskloof480.2
Voëlvlei164.1
Wemmershoek58.6
Source: City of Cape Town · 30 Oct 2026 – 30 Oct 2026 · All bars start at zero
Download imageShare image link

Method and sources

Capacity in millions of cubic metres, as listed in the City snapshot. Capacity is not the amount of water currently stored.

City of Cape Town figures, reading dated 2026-10-30.

Chart updated · 31 Oct 2026. The observation dates above describe the data, not today’s conditions.

Related charts

Water 30 Oct 2026

How full are Cape Town’s six big dams?

100.2% Steenbras Upper · Highest

Berg River: 94.4 % Berg River 94.4 Steenbras Lower: 47.7 % Steenbras Lower 47.7 Steenbras Upper: 100.2 % Steenbras Upper 100.2 Theewaterskloof: 73 % Theewaterskloof 73 Voëlvlei: 55 % Voëlvlei 55 Wemmershoek: 80.5 % Wemmershoek 80.5

Select a bar to inspect its value.

Each bar shows how full one dam is. A small dam that is full can still hold less water than a big dam that is half empty.

Source: City of Cape Town · All bars start at zero

Explore chart ↗
Water 30 Oct 2026

Which dam holds most of Cape Town’s water?

350.5million m³ Theewaterskloof · Highest

Berg River: 122.7 million m³ Berg River 122.7 Steenbras Lower: 16 million m³ Steenbras Lower 16 Steenbras Upper: 31.9 million m³ Steenbras Upper 31.9 Theewaterskloof: 350.5 million m³ Theewaterskloof 350.5 Voëlvlei: 90.3 million m³ Voëlvlei 90.3 Wemmershoek: 47.2 million m³ Wemmershoek 47.2

Select a bar to inspect its value.

Theewaterskloof holds the most water, even though some smaller dams are fuller.

Source: City of Cape Town · All bars start at zero

Explore chart ↗
Water 4 May 2026

Cape Town's dams held 48.3% in early May 2026, against 59.9% a year earlier

59.9% Same week, 2025 · Highest

How full Cape Town’s dams were in total, first week of May
Same week, 2025: 59.9 % Same week, 2025 59.9 4 May 2026: 48.3 % 4 May 2026 48.3

Select a bar to inspect its value.

Dam levels rose by one percentage point in a week, but were still 11.6 points lower than a year earlier. The city remained on early drought caution.

Source: City of Cape Town · All bars start at zero

Explore chart ↗