Share chart

← All charts

Environment · Chart

The satellite keeps seeing heat at the same few places

69days seen Piketberg (4 km) · Highest

These places show up again and again. They are often factories or farm burning rather than wildfires. The one near Piketberg shows up most often.
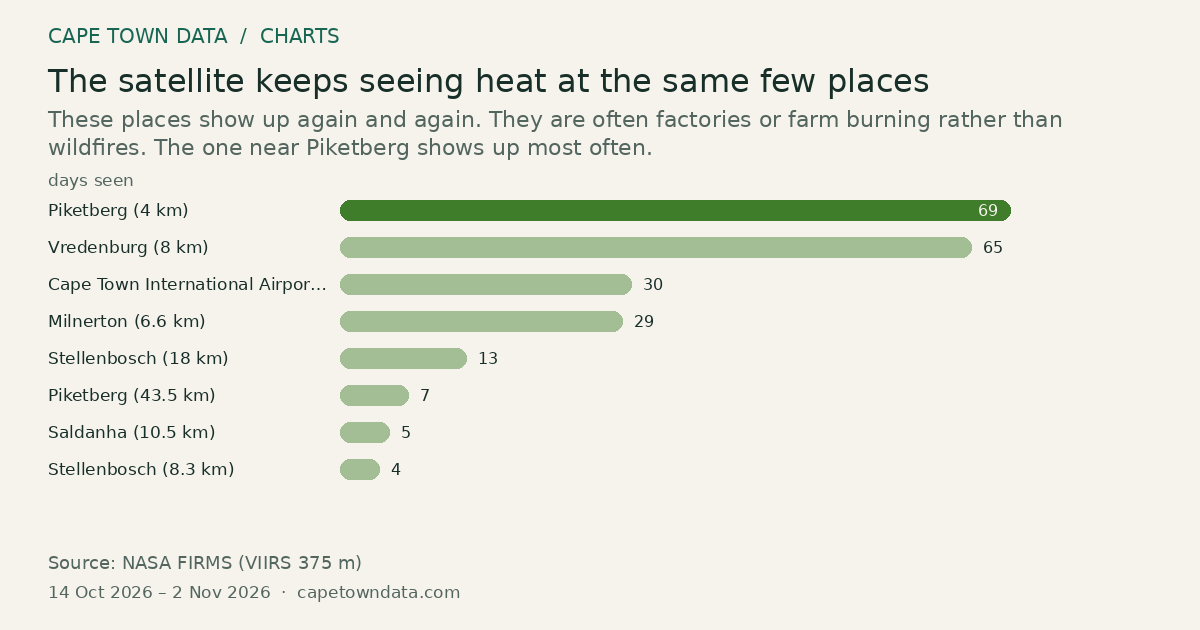
Places where heat was spotted on four or more days
days seen Piketberg (4 km): 69 days seen Piketberg (4 km) 69 Vredenburg (8 km): 65 days seen Vredenburg (8 km) 65 Cape Town International Airport (2.1 km): 30 days seen Cape Town International… 30 Milnerton (6.6 km): 29 days seen Milnerton (6.6 km) 29 Stellenbosch (18 km): 13 days seen Stellenbosch (18 km) 13 Piketberg (43.5 km): 7 days seen Piketberg (43.5 km) 7 Saldanha (10.5 km): 5 days seen Saldanha (10.5 km) 5 Stellenbosch (8.3 km): 4 days seen Stellenbosch (8.3 km) 4

Select a bar to inspect its value.

View data table
Observationdays seen
Piketberg (4 km)69
Vredenburg (8 km)65
Cape Town International Airport (2.1 km)30
Milnerton (6.6 km)29
Stellenbosch (18 km)13
Piketberg (43.5 km)7
Saldanha (10.5 km)5
Stellenbosch (8.3 km)4
Source: NASA FIRMS (VIIRS 375 m) · 14 Oct 2026 – 2 Nov 2026 · All bars start at zero
Download imageShare image link

Method and sources

Detections within about 1.5 km of each other are grouped into one site, and a site counts as persistent once it appears on at least four separate days. The bar is the number of distinct days that site was detected in the tracked history. These are recurring heat signatures, often industrial or agricultural burning, not necessarily wildfires. Each label gives the nearest reference place and its distance.

NASA FIRMS VIIRS detections, 2026-10-14 to 2026-11-02, read 2026-11-02.

Chart updated · 2 Nov 2026. The observation dates above describe the data, not today’s conditions.

Related charts

Environment 31 Dec 2025

Southern right whale calf numbers can change more than fivefold between counts

556cow-calf pairs 2023 · Highest

Mothers with calves counted from the air along the southern Cape coast, in the years with published counts
2019: 95 cow-calf pairs 2019 95 2023: 556 cow-calf pairs 2023 556 2025: 128 cow-calf pairs 2025 128

Select a bar to inspect its value.

The survey counted 95 pairs in 2019, a record 556 in 2023, and 128 in 2025.

Source: Mammal Research Institute Whale Unit, University of Pretoria · All bars start at zero

Explore chart ↗
Environment 29 Apr 2026

Cape Town’s firefighters are called to more than 13,000 vegetation fires a year

13,020incidents Vegetation fires · Highest

Call-outs to the City of Cape Town fire service by type, 1 May 2025 to 29 April 2026
Vegetation fires: 13,020 incidents Vegetation fires 13,020 Motor vehicle accidents: 4,991 incidents Motor vehicle accid… 4,991 Informal residential fires: 2,125 incidents Informal residentia… 2,125 Pedestrian accidents: 2,120 incidents Pedestrian accidents 2,120 Formal residential fires: 1,898 incidents Formal residential… 1,898

Select a bar to inspect its value.

Vegetation fires are the most common call-out, at 13,020 a year. Fires in formal houses are the rarest, at 1,898.

Source: City of Cape Town Fire and Rescue Service · All bars start at zero

Explore chart ↗
Environment 31 Jan 2026

Fatal drownings on Cape Town's coastline fell to five in the 2025/26 festive season

15fatal drownings 2022/23 · Highest

Fatal drownings recorded on the City of Cape Town coastline, by festive season.
2022/23: 15 fatal drownings 2022/23 15 2023/24: 9 fatal drownings 2023/24 9 2024/25: 11 fatal drownings 2024/25 11 2025/26: 5 fatal drownings 2025/26 5

Select a bar to inspect its value.

That is the lowest number in four years. All five happened outside the areas marked for swimming.

Source: City of Cape Town · All bars start at zero

Explore chart ↗