Environment · Chart
Southern right whale calf numbers can change more than fivefold between counts
556cow-calf pairs 2023 · Highest
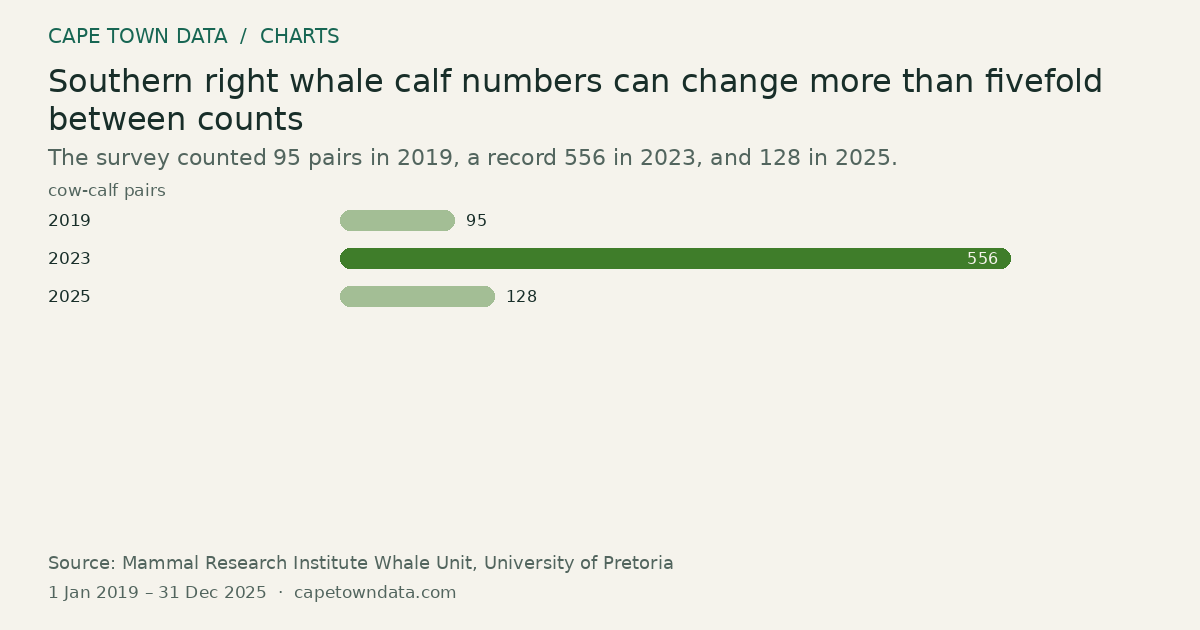
The survey counted 95 pairs in 2019, a record 556 in 2023, and 128 in 2025.
 From our storiesEverything you need to know about Western Cape Whale SeasonRead the full story →
Method and sources
Each bar is the number of southern right whale cow-calf pairs counted in the Whale Unit's annual aerial survey, flown each spring along the coast between Nature's Valley and Muizenberg, as reported in the article.
2019: 95 pairs, the second-lowest count since 1995.
2023: 556 pairs, the highest in the series.
2025: 128 pairs, plus 11 unaccompanied adults, in a survey flown over three days in late September.
The bars are not consecutive years. The article's own chart runs from 1969 to 2025, but the article states that only these three values are confirmed in the published series and that the years in between are reconstructed from the long-run trend, so only the confirmed years are shown here.
The article gives years only, so the period runs from 1 January 2019 to 31 December 2025.
Sources: Mammal Research Institute Whale Unit, University of Pretoria (https://www.mammalresearchinstitute.science/whale-unit) and CapeNature's 2025 annual survey report.
Figures as published in our article on the Western Cape whale season (last updated 16 May 2026): Mammal Research Institute Whale Unit annual aerial survey, and CapeNature's 2025 survey report.
Chart updated · 14 Sep 2026. The observation dates above describe the data, not today’s conditions.
Related charts
Cape Town’s firefighters are called to more than 13,000 vegetation fires a year
13,020incidents Vegetation fires · Highest
Select a bar to inspect its value.
Vegetation fires are the most common call-out, at 13,020 a year. Fires in formal houses are the rarest, at 1,898.
Source: City of Cape Town Fire and Rescue Service · All bars start at zero
Fatal drownings on Cape Town's coastline fell to five in the 2025/26 festive season
15fatal drownings 2022/23 · Highest
Select a bar to inspect its value.
That is the lowest number in four years. All five happened outside the areas marked for swimming.
Source: City of Cape Town · All bars start at zero
How many fires does the satellite see over the Western Cape?
31heat spots 28 Oct · Highest
Select a bar to inspect its value.
Some days are quiet. On busy days the satellite picks up twelve or more heat spots.
Source: NASA FIRMS (VIIRS 375 m) · All bars start at zero