Environment · Chart
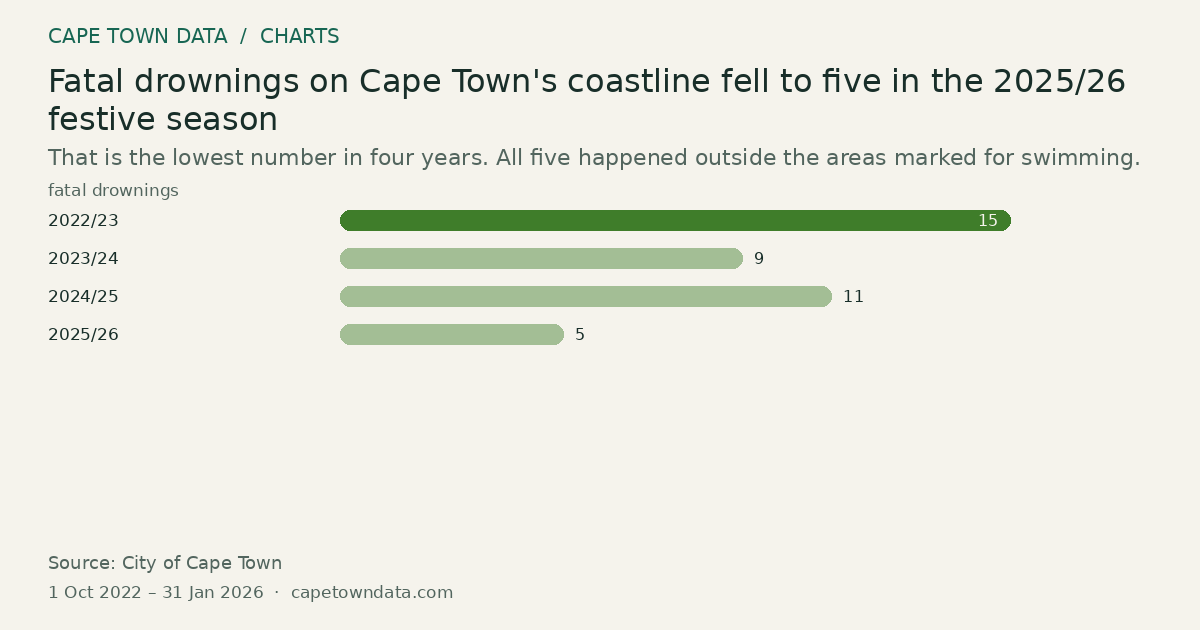
Fatal drownings on Cape Town's coastline fell to five in the 2025/26 festive season
15fatal drownings 2022/23 · Highest
That is the lowest number in four years. All five happened outside the areas marked for swimming.
 From our storiesWhat are the Most Dangerous Beaches in and Around Cape Town?Read the full story →
Method and sources
Each bar is the number of fatal drownings recorded on the City of Cape Town coastline in a festive season, as reported in the article. A season runs roughly from October to January.
2022/23: 15. 2023/24: 9. 2024/25: 11. 2025/26: 5.
The article notes that all five fatal incidents in 2025/26 occurred outside designated bathing areas, and that the City credits expanded lifeguard hours, the Identikidz programme, which tagged 101,780 children, and the Safe Zones campaign.
The article gives seasons rather than dates, so the period runs from the start of the first season, October 2022, to the end of the last, January 2026.
Sources: City of Cape Town, Community Services and Health (https://www.capetown.gov.za/)
Figures as published in our article on Cape Town's most dangerous beaches (chart last checked 14 September 2026): City of Cape Town Community Services and Health festive season drowning counts. Link to the publisher, not the exact table.
Chart updated · 28 Sep 2026. The observation dates above describe the data, not today’s conditions.
Related charts
Southern right whale calf numbers can change more than fivefold between counts
556cow-calf pairs 2023 · Highest
Select a bar to inspect its value.
The survey counted 95 pairs in 2019, a record 556 in 2023, and 128 in 2025.
Source: Mammal Research Institute Whale Unit, University of Pretoria · All bars start at zero
Cape Town’s firefighters are called to more than 13,000 vegetation fires a year
13,020incidents Vegetation fires · Highest
Select a bar to inspect its value.
Vegetation fires are the most common call-out, at 13,020 a year. Fires in formal houses are the rarest, at 1,898.
Source: City of Cape Town Fire and Rescue Service · All bars start at zero
How many fires does the satellite see over the Western Cape?
31heat spots 28 Oct · Highest
Select a bar to inspect its value.
Some days are quiet. On busy days the satellite picks up twelve or more heat spots.
Source: NASA FIRMS (VIIRS 375 m) · All bars start at zero