Weather · Chart
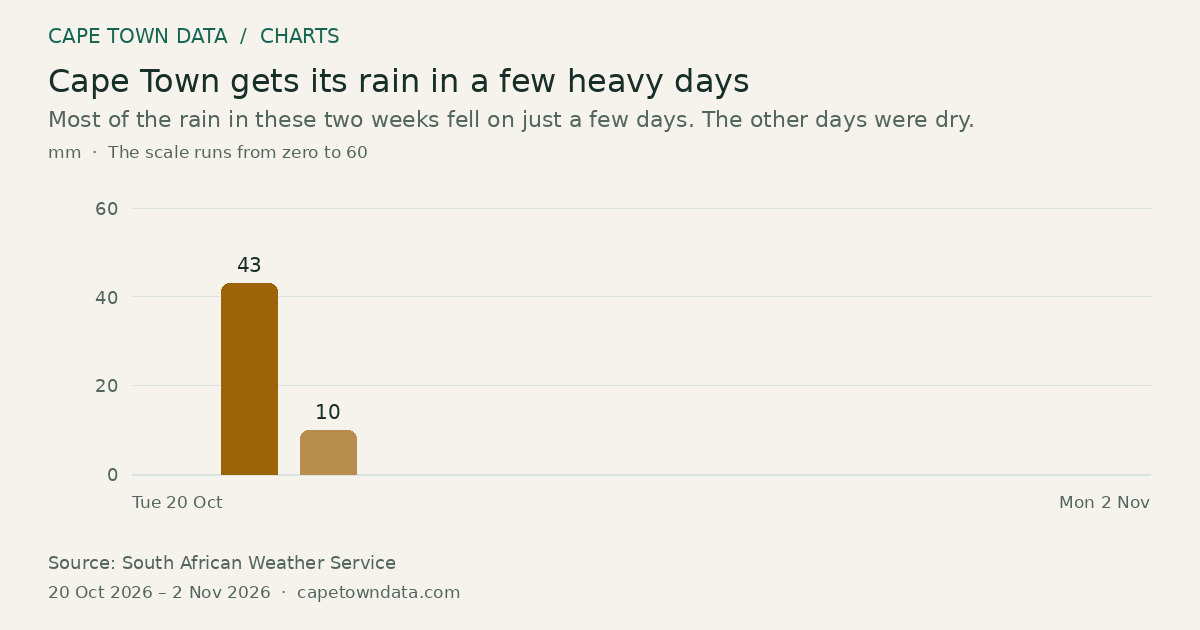
Cape Town gets its rain in a few heavy days
43mm Wed 21 Oct · Highest
Most of the rain in these two weeks fell on just a few days. The other days were dry.
Select a point to inspect its value.
View data table
| Observation | mm |
|---|---|
| Mon 19 Oct | 0 |
| Tue 20 Oct | 0 |
| Wed 21 Oct | 43 |
| Thu 22 Oct | 10 |
| Fri 23 Oct | 0 |
| Sat 24 Oct | 0 |
| Sun 25 Oct | 0 |
| Mon 26 Oct | 0 |
| Tue 27 Oct | 0 |
| Wed 28 Oct | 0 |
| Thu 29 Oct | 0 |
| Sat 31 Oct | 0 |
| Sun 1 Nov | 0 |
Method and sources
Daily rainfall at Molteno Reservoir, the City Bowl proxy station used by the daily rainfall log, for the 24 hours ending at 08:00 on each date. The weather service publishes only stations that filed a reading, so a day on which the station is absent from a published bulletin is shown as zero, and a day with no bulletin at all is left out rather than drawn as no rain.
South African Weather Service daily bulletins, Molteno Reservoir, 2026-10-19 to 2026-11-01.
Chart updated · 2 Nov 2026. The observation dates above describe the data, not today’s conditions.
Related charts
How much rain fell in the Cape Peninsula and Winelands as the second May 2026 front arrived?
69mm Ceres AWS · Highest
Select a bar to inspect its value.
Ceres AWS measured the most at 69 mm, Kirstenbosch recorded 52 mm and Cape Town WO 24 mm.
Source: South African Weather Service (SAWS) · All bars start at zero
Rain on 7 May 2026: three Garden Route stations topped Cape Town's May average in one day
162mm Plett Bay Newlands · Highest
Select a bar to inspect its value.
Plett Bay Newlands (162 mm), Knysna Kleingrysbos (161 mm) and George Witfontein (137 mm) each recorded more than Cape Town's May average of about 136 mm.
Source: South African Weather Service (SAWS) · All bars start at zero
July 2026 was dry across the whole south-western Cape, not only at the airport
27.6mm Paarl · Highest
Select a bar to inspect its value.
The airport’s record-low 14.4 mm was not a one-off. Malmesbury had only 3.2 mm, and even Paarl, the wettest of the five, had just 27.6 mm.
Source: South African Weather Service · All bars start at zero