Weather · Chart
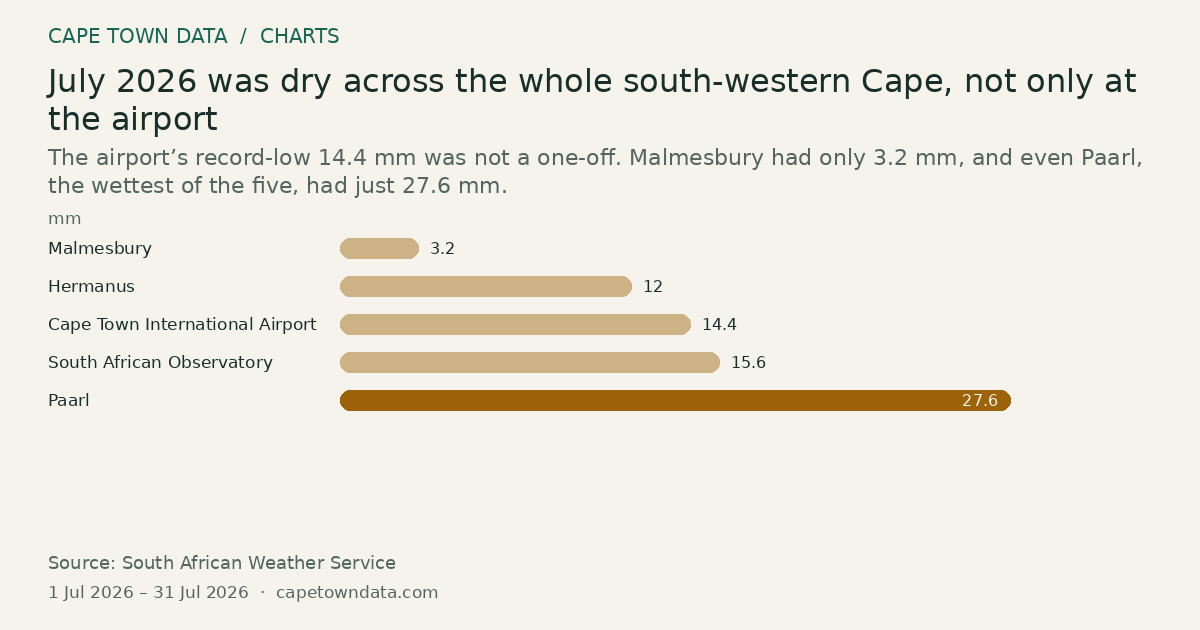
July 2026 was dry across the whole south-western Cape, not only at the airport
27.6mm Paarl · Highest
The airport’s record-low 14.4 mm was not a one-off. Malmesbury had only 3.2 mm, and even Paarl, the wettest of the five, had just 27.6 mm.
 From our storiesCape Town's Driest July Since 1958: The Rain, the Dams and Two FiresRead the full story →
Method and sources
Each bar is the total rainfall a station recorded in July 2026, in millimetres, as reported in the article.
Malmesbury 3.2 millimetres, Hermanus 12 millimetres, Cape Town International Airport 14.4 millimetres, South African Observatory 15.6 millimetres, Paarl 27.6 millimetres.
The article gives the airport total as the lowest July figure since that station's records began in 1958, about 16 percent of its long-term July average of roughly 90 millimetres, and the Observatory total as its driest July in 91 years. Those comparison figures are approximate in the article and are not plotted here.
The period is the July 2026 calendar month, which is the month the article measures.
Sources: South African Weather Service (https://www.weathersa.co.za/)
Figures as published in our article on Cape Town's driest July since 1958 (chart last checked 14 September 2026): South African Weather Service station totals for July 2026. The link is to the publisher, not the exact table.
Chart updated · 14 Sep 2026. The observation dates above describe the data, not today’s conditions.
Related charts
How much rain fell in the Cape Peninsula and Winelands as the second May 2026 front arrived?
69mm Ceres AWS · Highest
Select a bar to inspect its value.
Ceres AWS measured the most at 69 mm, Kirstenbosch recorded 52 mm and Cape Town WO 24 mm.
Source: South African Weather Service (SAWS) · All bars start at zero
Rain on 7 May 2026: three Garden Route stations topped Cape Town's May average in one day
162mm Plett Bay Newlands · Highest
Select a bar to inspect its value.
Plett Bay Newlands (162 mm), Knysna Kleingrysbos (161 mm) and George Witfontein (137 mm) each recorded more than Cape Town's May average of about 136 mm.
Source: South African Weather Service (SAWS) · All bars start at zero
Cape Town gets its rain in winter: 95 mm in June, 8 mm in February
95mm June · Highest
Select a bar to inspect its value.
Almost four fifths of the year’s rain falls between April and September. Summer visits are usually dry.
Source: South African Weather Service · All bars start at zero