Crime · Chart
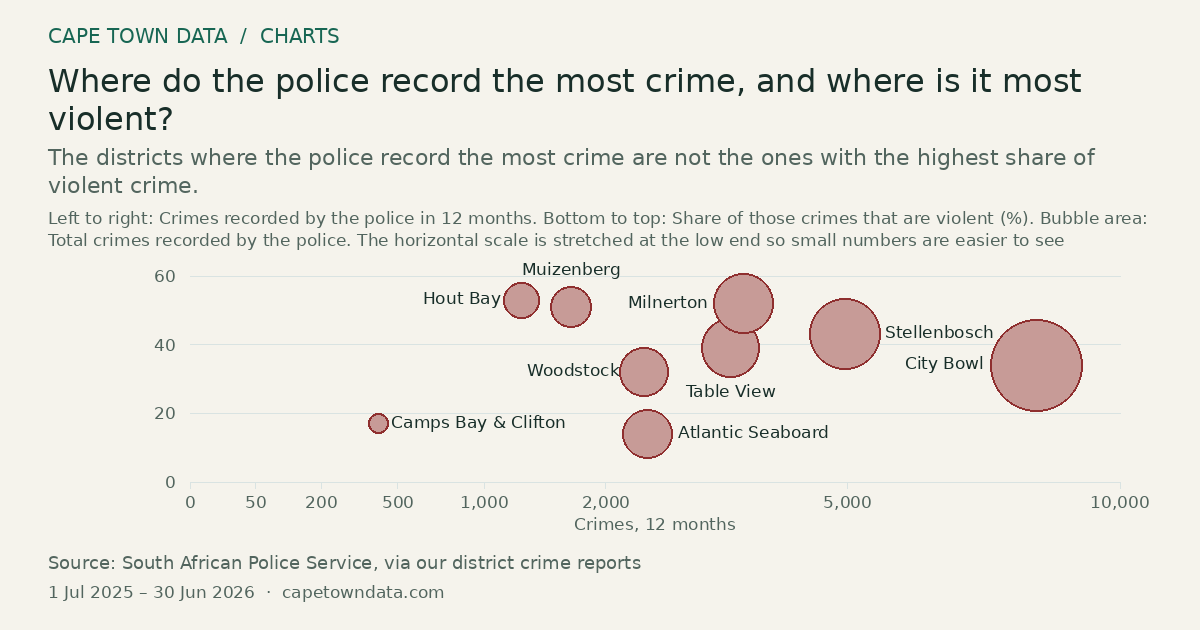
Where do the police record the most crime, and where is it most violent?
53% Hout Bay · Highest
The districts where the police record the most crime are not the ones with the highest share of violent crime.
Select a bubble to inspect its values.
View data table
| Observation | % |
|---|---|
| Atlantic Seaboard | 14 |
| Table View | 39 |
| Camps Bay & Clifton | 17 |
| City Bowl | 34 |
| Hout Bay | 53 |
| Milnerton | 52 |
| Muizenberg | 51 |
| Stellenbosch | 43 |
| Woodstock | 32 |
| Crimes recorded by the police in 12 months | Share of those crimes that are violent (%) | Total crimes recorded by the police | |
|---|---|---|---|
| Atlantic Seaboard | 2,421 | 14 | 2,421 |
| Table View | 3,379 | 39 | 3,379 |
| Camps Bay & Clifton | 411 | 17 | 411 |
| City Bowl | 8,278 | 34 | 8,278 |
| Hout Bay | 1,268 | 53 | 1,268 |
| Milnerton | 3,545 | 52 | 3,545 |
| Muizenberg | 1,679 | 51 | 1,679 |
| Stellenbosch | 4,956 | 43 | 4,956 |
| Woodstock | 2,380 | 32 | 2,380 |
Method and sources
Left to right: the crimes the South African Police Service recorded at the district's stations in the latest four published quarters, across the seven crime types our district reports use. Bottom to top: how much of that total is violent crime (murder, sexual offences, robbery and assault). Each bubble's area is the same total. One source and one period for every district: SAPS' own station figures for the same 12 months the district reports show, as on the crime index. Districts without a complete 12 months of authoritative police figures are left out and named below. Drug offences are not included, and police station areas do not match our district boundaries exactly.
SAPS station counts for the 12 months 2025-07-01 to 2026-06-30, as published in our district reports. Left out: N2 Airport Route, Peninsula Hiking Trails (no police station figures of their own).
Chart updated · 23 Sep 2026. The observation dates above describe the data, not today’s conditions.
Related charts
What kinds of crime do the police record in Atlantic Seaboard?
1,116recorded crimes Car crime · Highest
Select an axis to inspect its value.
Car crime is the most common crime the police recorded in Atlantic Seaboard. Property crime is more common there than violent crime.
Source: South African Police Service, via our district crime reports · Each axis from zero to 1,500
What kinds of crime do the police record in Table View?
1,076recorded crimes Theft · Highest
Select an axis to inspect its value.
Theft is the most common crime the police recorded in Table View. Property crime is more common there than violent crime.
Source: South African Police Service, via our district crime reports · Each axis from zero to 1,500
What kinds of crime do the police record in Camps Bay & Clifton?
193recorded crimes Theft · Highest
Select an axis to inspect its value.
Theft is the most common crime the police recorded in Camps Bay & Clifton. Property crime is more common there than violent crime.
Source: South African Police Service, via our district crime reports · Each axis from zero to 200