Population · Chart
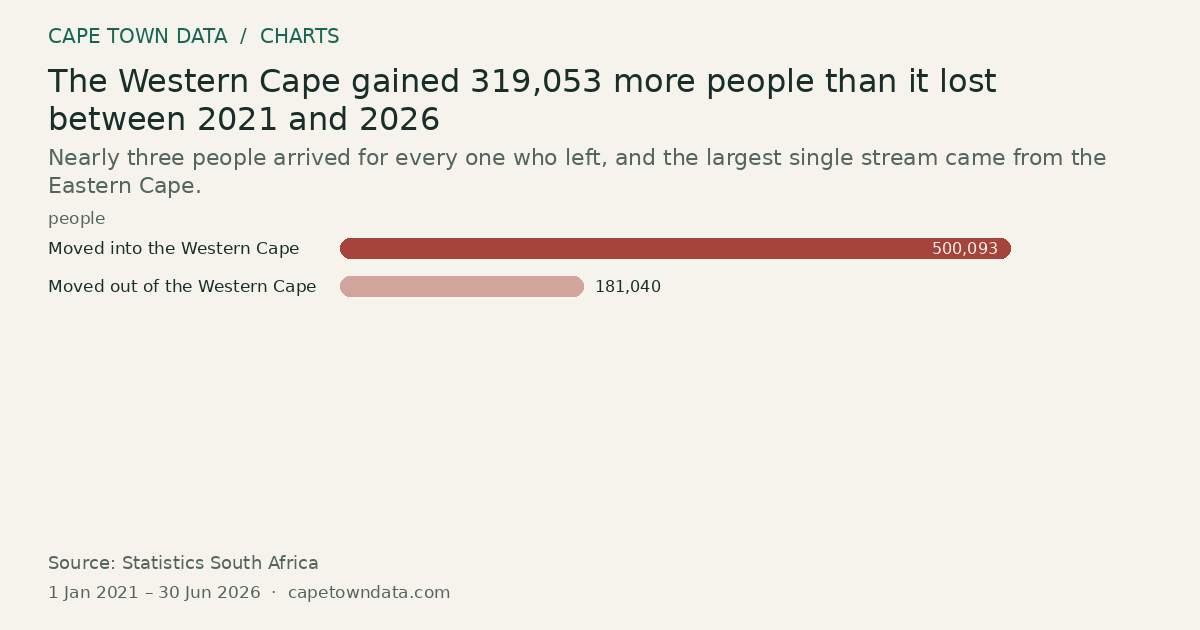
The Western Cape gained 319,053 more people than it lost between 2021 and 2026
500,093people Moved into the Western Cape · Highest
Nearly three people arrived for every one who left, and the largest single stream came from the Eastern Cape.
 From our storiesWhat are Cape Town biggest challenges in 2026?Read the full story →
Method and sources
Each bar is the number of people recorded moving into or out of the Western Cape between 2021 and 2026, as reported in the article.
Moved into the Western Cape: 500,093. Moved out of the Western Cape: 181,040. The net gain is 319,053.
The article gives the largest streams into the province as the Eastern Cape with 171,525 people and Gauteng with 114,773.
The article gives only the span 2021 to 2026, so the period runs from 1 January 2021 to the mid-year point of the 2026 estimates, 30 June 2026.
Sources: Statistics South Africa, Mid-Year Population Estimates 2026 (https://www.statssa.gov.za/)
Figures as published in our article on Cape Town's biggest challenges in 2026 (chart last checked 14 September 2026): Stats SA Mid-Year Population Estimates 2026, released 30 July 2026. Link to the publisher, not the exact table.
Chart updated · 3 Oct 2026. The observation dates above describe the data, not today’s conditions.
Related charts
Matric 2025: the Western Cape had the second-highest share of bachelor passes
52% Free State · Highest
Select a bar to inspect its value.
Free State led at 52.0%, the Western Cape followed at 49.2%, and Northern Cape was lowest at 36.2%.
Source: Department of Basic Education and Western Cape Education Department · All bars start at zero
Fewer South African readers get their books from public libraries
48% 2006 · Highest
Select a bar to inspect its value.
The share fell from 48% in 2006 to 24% in 2016 and 17% in 2023, a drop of 31 percentage points.
Source: National Reading Barometer · All bars start at zero
The more educated South Africans are, the more of them have considered emigrating
38% University+ · Highest
Select a bar to inspect its value.
38% of university-educated adults had considered emigrating, almost four times the 10% of those with primary schooling.
Source: Afrobarometer · All bars start at zero