Population · Chart
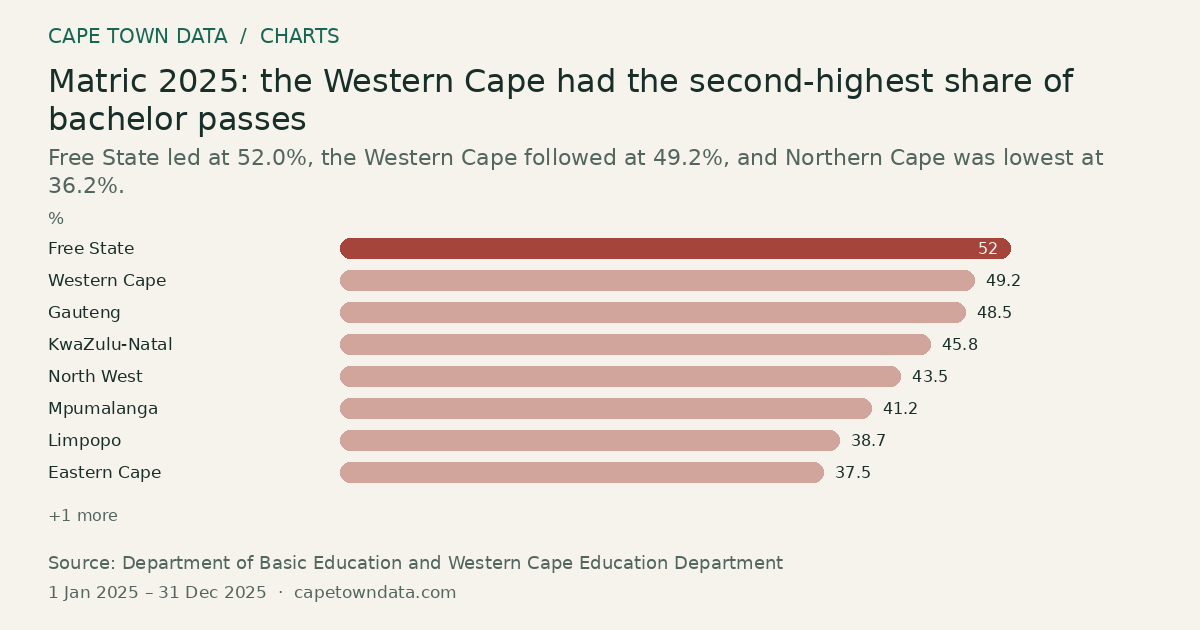
Matric 2025: the Western Cape had the second-highest share of bachelor passes
52% Free State · Highest
Free State led at 52.0%, the Western Cape followed at 49.2%, and Northern Cape was lowest at 36.2%.
 From our storiesWhere are Cape Town's best schools?Read the full story →
Method and sources
Each bar is a province's bachelor pass rate in the 2025 National Senior Certificate (matric) examinations, as reported in the article. A bachelor pass is an NSC pass that qualifies for direct university entry. The rate is a share of all candidates who wrote, not of those who passed.
Free State 52.0%, Western Cape 49.2%, Gauteng 48.5%, KwaZulu-Natal 45.8%, North West 43.5%, Mpumalanga 41.2%, Limpopo 38.7%, Eastern Cape 37.5%, Northern Cape 36.2%. The article gives a South African average of about 45.0%.
The article notes that Free State's lead is partly driven by smaller candidate numbers and a different mix of schools.
The results were released in January 2026. The article gives the examination year only, so the period is the 2025 calendar year.
Sources: Department of Basic Education and Western Cape Education Department, NSC 2025 results announcement (https://www.westerncape.gov.za/education/)
Figures as published in our article on Cape Town's best schools (last updated 30 April 2026): DBE and WCED National Senior Certificate 2025 examination results, released January 2026.
Chart updated · 14 Sep 2026. The observation dates above describe the data, not today’s conditions.
Related charts
Fewer South African readers get their books from public libraries
48% 2006 · Highest
Select a bar to inspect its value.
The share fell from 48% in 2006 to 24% in 2016 and 17% in 2023, a drop of 31 percentage points.
Source: National Reading Barometer · All bars start at zero
The more educated South Africans are, the more of them have considered emigrating
38% University+ · Highest
Select a bar to inspect its value.
38% of university-educated adults had considered emigrating, almost four times the 10% of those with primary schooling.
Source: Afrobarometer · All bars start at zero
Home Affairs cleared a backlog of 306,000 visa applications, the largest of three queues
306,000applications Visa applications · Highest
Select a bar to inspect its value.
The visa backlog was the biggest at 306,000 applications. Clearing it made later changes possible, such as dropping the medical report requirement.
Source: Department of Home Affairs · All bars start at zero