Population · Chart
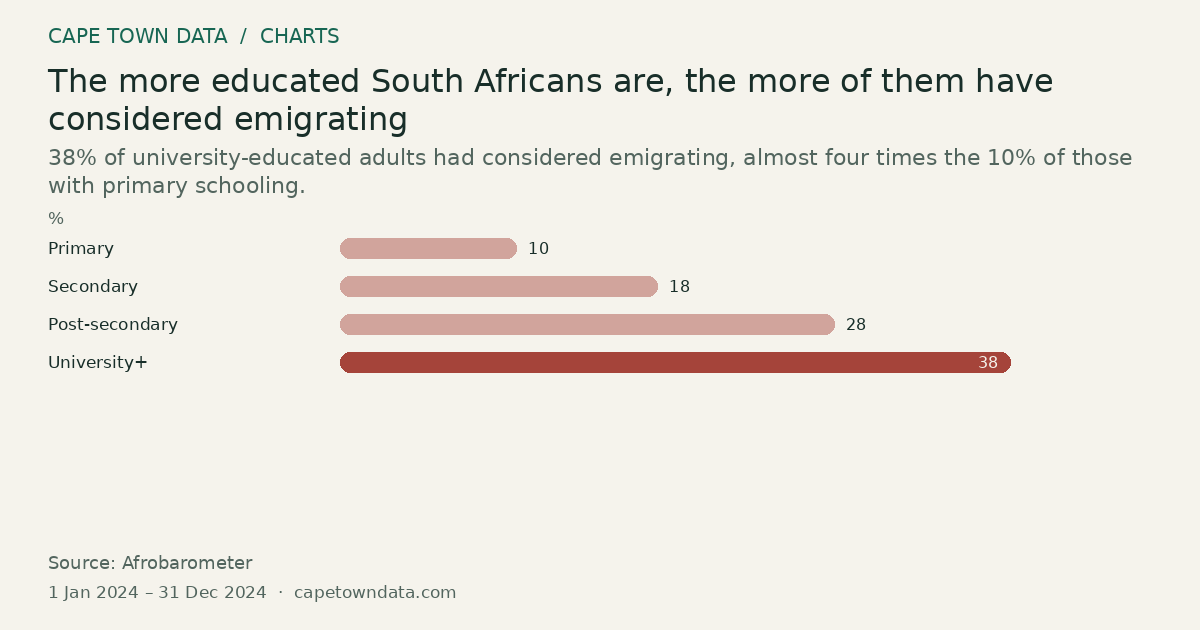
The more educated South Africans are, the more of them have considered emigrating
38% University+ · Highest
38% of university-educated adults had considered emigrating, almost four times the 10% of those with primary schooling.
 From our storiesWhere Are South Africans Emigrating? Data-Driven Analysis 2026Read the full story →
Method and sources
Each bar is the proportion of adults within an education group who have considered emigrating, from Afrobarometer's survey as reported in the article.
Primary 10%, secondary 18%, post-secondary 28%, university or higher 38%.
The article gives 27% for all adults and 42% for the economically well-off, from a survey of 1,582 South African adults. Having considered emigrating is not the same as planning to leave or leaving.
The article describes this as Afrobarometer's 2024 survey, published as Dispatch No. 914 in December 2024, and gives no fieldwork dates, so the period is the 2024 calendar year.
Source: Afrobarometer Dispatch No. 914 (https://www.afrobarometer.org/publication/ad914-south-africans-thinking-about-emigration-most-educated-wealthiest-employed-young/)
Figures as published in our article on where South Africans are emigrating (last updated 3 July 2026): Afrobarometer Dispatch No. 914 on South Africans thinking about emigration, December 2024.
Chart updated · 14 Sep 2026. The observation dates above describe the data, not today’s conditions.
Related charts
Matric 2025: the Western Cape had the second-highest share of bachelor passes
52% Free State · Highest
Select a bar to inspect its value.
Free State led at 52.0%, the Western Cape followed at 49.2%, and Northern Cape was lowest at 36.2%.
Source: Department of Basic Education and Western Cape Education Department · All bars start at zero
Fewer South African readers get their books from public libraries
48% 2006 · Highest
Select a bar to inspect its value.
The share fell from 48% in 2006 to 24% in 2016 and 17% in 2023, a drop of 31 percentage points.
Source: National Reading Barometer · All bars start at zero
Home Affairs cleared a backlog of 306,000 visa applications, the largest of three queues
306,000applications Visa applications · Highest
Select a bar to inspect its value.
The visa backlog was the biggest at 306,000 applications. Clearing it made later changes possible, such as dropping the medical report requirement.
Source: Department of Home Affairs · All bars start at zero