Population · Chart
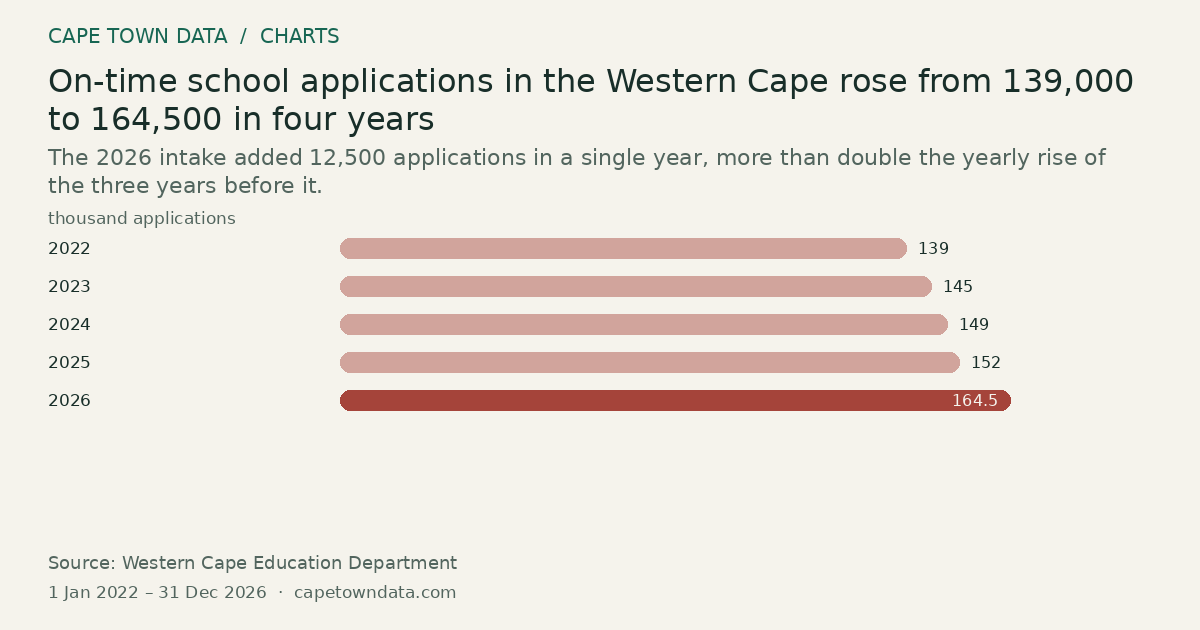
On-time school applications in the Western Cape rose from 139,000 to 164,500 in four years
164.5thousand applications 2026 · Highest
The 2026 intake added 12,500 applications in a single year, more than double the yearly rise of the three years before it.
 From our storiesWestern Cape Semigration: The Data 2020 to 2026Read the full story →
Method and sources
Each bar is the number of Grade R, Grade 1 and Grade 8 applications received by the Western Cape Education Department inside the on-time application window, in thousands, as printed in the article's chart.
2022: 139k.
2023: 145k.
2024: 149k.
2025: 152k.
2026: 164.5k, an increase of 12.5k on 2025.
The article notes that the 2026 figure includes about 13,000 learners arriving from the Eastern Cape. It gives intake years only, so each bar is dated to its calendar year.
Sources: Western Cape Education Department (https://www.westerncape.gov.za/education/) The link is to the publisher, not the exact admissions report.
Figures as published in our article on Western Cape semigration (chart last checked 14 September 2026): Western Cape Education Department admissions reports.
Chart updated · 23 Oct 2026. The observation dates above describe the data, not today’s conditions.
Related charts
Matric 2025: the Western Cape had the second-highest share of bachelor passes
52% Free State · Highest
Select a bar to inspect its value.
Free State led at 52.0%, the Western Cape followed at 49.2%, and Northern Cape was lowest at 36.2%.
Source: Department of Basic Education and Western Cape Education Department · All bars start at zero
Fewer South African readers get their books from public libraries
48% 2006 · Highest
Select a bar to inspect its value.
The share fell from 48% in 2006 to 24% in 2016 and 17% in 2023, a drop of 31 percentage points.
Source: National Reading Barometer · All bars start at zero
The more educated South Africans are, the more of them have considered emigrating
38% University+ · Highest
Select a bar to inspect its value.
38% of university-educated adults had considered emigrating, almost four times the 10% of those with primary schooling.
Source: Afrobarometer · All bars start at zero