Water · Chart
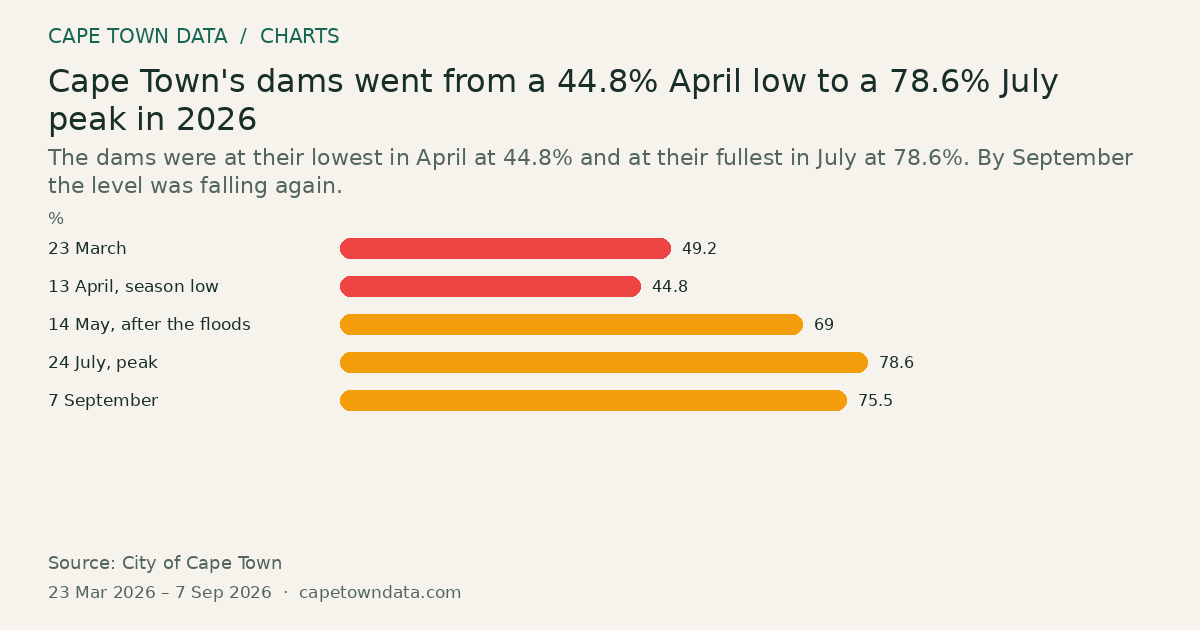
Cape Town's dams went from a 44.8% April low to a 78.6% July peak in 2026
78.6% 24 July, peak · Highest
The dams were at their lowest in April at 44.8% and at their fullest in July at 78.6%. By September the level was falling again.
 From our storiesWhat are Cape Town biggest challenges in 2026?Read the full story →
Method and sources
Each bar is combined Western Cape Water Supply System storage as a percentage of capacity on a dated City reading, as reported in the article.
23 March 49.2%, 13 April 44.8% (the low point of the year), 14 May 69.0% (the end of the flood week, up 20.7 points from 50.9% on 11 May), 24 July 78.6% (the peak), 7 September 75.5%.
The article notes that 75.5% is 16.9 points below the same week of 2025, when storage stood at 92.4%, and that the City's March modelling had wrongly pointed to about 40% in May.
Each bar is a single reading date, so the period runs from the first to the last of them.
Sources: City of Cape Town weekly dam readings and water dashboard (https://www.capetown.gov.za/)
Figures as published in our article on Cape Town's biggest challenges in 2026 (chart last checked 14 September 2026): City of Cape Town weekly dam readings and water dashboard, reading of 7 September 2026. Link to the publisher, not the exact table.
Chart updated · 6 Oct 2026. The observation dates above describe the data, not today’s conditions.
Related charts
How full are Cape Town’s six big dams?
100.2% Steenbras Upper · Highest
Select a bar to inspect its value.
Each bar shows how full one dam is. A small dam that is full can still hold less water than a big dam that is half empty.
Source: City of Cape Town · All bars start at zero
One dam can hold more water than the other five together
480.2million m³ Theewaterskloof · Highest
Select a bar to inspect its value.
Theewaterskloof can hold more than half of all the water Cape Town’s dams can store.
Source: City of Cape Town · All bars start at zero
Which dam holds most of Cape Town’s water?
350.5million m³ Theewaterskloof · Highest
Select a bar to inspect its value.
Theewaterskloof holds the most water, even though some smaller dams are fuller.
Source: City of Cape Town · All bars start at zero