Population · Chart
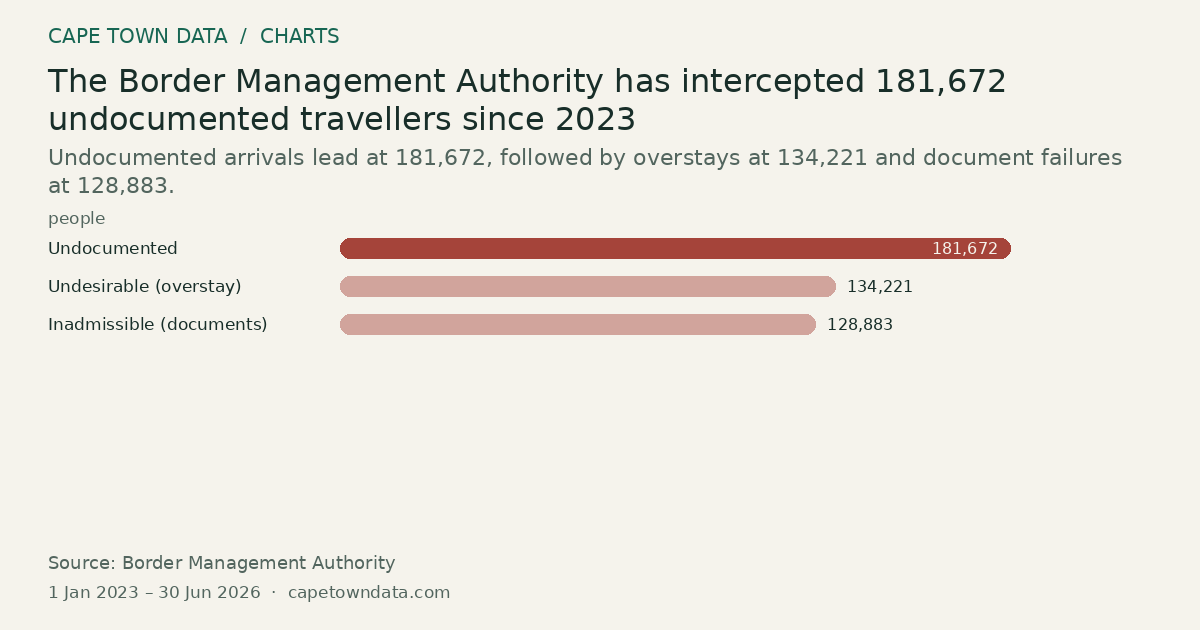
The Border Management Authority has intercepted 181,672 undocumented travellers since 2023
181,672people Undocumented · Highest
Undocumented arrivals lead at 181,672, followed by overstays at 134,221 and document failures at 128,883.
 From our storiesEpping and the Data Behind South Africa's 2026 Migrant DeparturesRead the full story →
Method and sources
Each bar is a cumulative count of people intercepted or refused entry in one category since the Border Management Authority was established in 2023, as reported in the article.
Undocumented 181,672. Undesirable, meaning overstay, 134,221. Inadmissible, meaning a document failure, 128,883.
The article notes these are the Authority's three largest categories and are not a complete decomposition of its headline figure.
The article gives no exact start or end dates, so the period is approximated as 1 January 2023, the year of the Authority's establishment, to 30 June 2026, the month the figures were reported.
Sources: Border Management Authority (https://www.bma.gov.za/)
Figures as published in our article on Epping and the 2026 migrant departures (chart last checked 14 September 2026): Border Management Authority cumulative counts since its establishment in 2023, reported June 2026.
Chart updated · 28 Oct 2026. The observation dates above describe the data, not today’s conditions.
Related charts
Matric 2025: the Western Cape had the second-highest share of bachelor passes
52% Free State · Highest
Select a bar to inspect its value.
Free State led at 52.0%, the Western Cape followed at 49.2%, and Northern Cape was lowest at 36.2%.
Source: Department of Basic Education and Western Cape Education Department · All bars start at zero
Fewer South African readers get their books from public libraries
48% 2006 · Highest
Select a bar to inspect its value.
The share fell from 48% in 2006 to 24% in 2016 and 17% in 2023, a drop of 31 percentage points.
Source: National Reading Barometer · All bars start at zero
The more educated South Africans are, the more of them have considered emigrating
38% University+ · Highest
Select a bar to inspect its value.
38% of university-educated adults had considered emigrating, almost four times the 10% of those with primary schooling.
Source: Afrobarometer · All bars start at zero