Economy · Chart
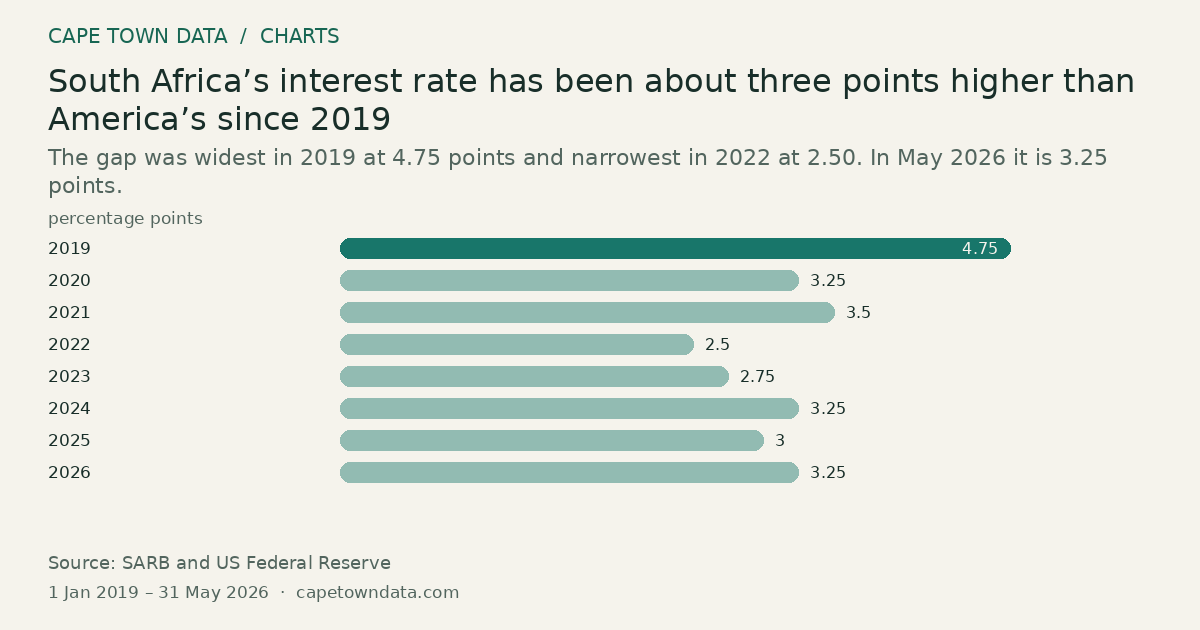
South Africa’s interest rate has been about three points higher than America’s since 2019
4.75percentage points 2019 · Highest
The gap was widest in 2019 at 4.75 points and narrowest in 2022 at 2.50. In May 2026 it is 3.25 points.
 From our storiesThe Reserve Bank just raised rates. Here is why that was a difficult decisionRead the full story →
Method and sources
Each bar is the difference between the South African repo rate and the United States policy rate, in percentage points, as printed on the article's chart. Values are year-end, with 2026 as at May.
2019: 4.75. 2020: 3.25. 2021: 3.50. 2022: 2.50. 2023: 2.75. 2024: 3.25. 2025: 3.00. 2026: 3.25.
The article puts the average gap at 3.3 points. Each bar is dated to its year, so the period runs from 1 January 2019 to 31 May 2026.
Sources: South African Reserve Bank and the US Federal Reserve, via the South African Reserve Bank (https://www.resbank.co.za/) The link is to one of the publishers, not the exact table.
Figures as published in our article on the May 2026 repo rate rise (chart last checked 14 September 2026): the difference in year-end policy rates, 2026 as at May.
Chart updated · 18 Oct 2026. The observation dates above describe the data, not today’s conditions.
Related charts
The Western Cape took 360,347 of South Africa's 404,712 net new jobs in five years
360,347net new jobs Western Cape · Highest
Select a bar to inspect its value.
Nine in every ten of the country’s extra jobs were in one province, which has about an eighth of the population.
Source: Statistics South Africa · All bars start at zero
Hospitals and specialists take almost two thirds of medical scheme benefits
36% Hospitals · Highest
Select a bar to inspect its value.
Hospitals took 36% and specialists 28%. Together that is almost two thirds of all the money paid out.
Source: Council for Medical Schemes · All bars start at zero
The most a gap cover policy can pay out has risen from R150,000 to R223,000 since 2017
223,000R April 2026 · Highest
Select a bar to inspect its value.
The limit goes up with inflation every April. From April 2026 it is R223,000.
Source: National Treasury · All bars start at zero