Economy · Chart
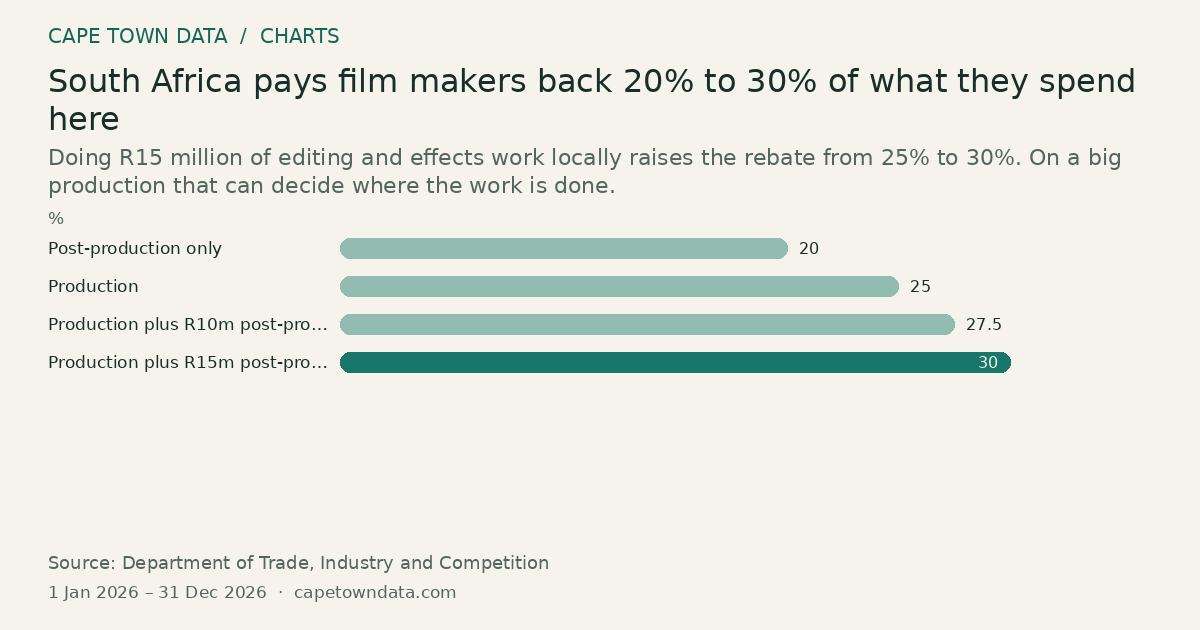
South Africa pays film makers back 20% to 30% of what they spend here
30% Production plus R15m post-production · Highest
Doing R15 million of editing and effects work locally raises the rebate from 25% to 30%. On a big production that can decide where the work is done.
 From our storiesCape Town's Film Economy: 2026 Data AnalysisRead the full story →
Method and sources
Each bar is a headline rebate rate under the South African production and post-production incentive, expressed as a share of qualifying local spend refunded, as reported in the article.
Post-production only 20%. Production 25%. Production with a further R10 million of post-production 27.5%. Production with a further R15 million of post-production 30%.
Each rate depends on minimum spend thresholds and compliance conditions, and the article stresses these are the published structure rather than a guaranteed outcome. The article's worked example is a series spending R100 million locally, returning R25 million at the base rate and roughly R30 million at the top rate.
The article gives no dates for the rate schedule, so the period is approximated as the 2026 calendar year, the year the article describes.
Sources: Department of Trade, Industry and Competition incentive guidelines (https://www.thedtic.gov.za/)
Figures as published in our article on Cape Town's film economy (chart last checked 14 September 2026): DTIC production and post-production incentive guidelines. The link is to the publisher, not the exact guideline document.
Chart updated · 31 Oct 2026. The observation dates above describe the data, not today’s conditions.
Related charts
The Western Cape took 360,347 of South Africa's 404,712 net new jobs in five years
360,347net new jobs Western Cape · Highest
Select a bar to inspect its value.
Nine in every ten of the country’s extra jobs were in one province, which has about an eighth of the population.
Source: Statistics South Africa · All bars start at zero
Hospitals and specialists take almost two thirds of medical scheme benefits
36% Hospitals · Highest
Select a bar to inspect its value.
Hospitals took 36% and specialists 28%. Together that is almost two thirds of all the money paid out.
Source: Council for Medical Schemes · All bars start at zero
The most a gap cover policy can pay out has risen from R150,000 to R223,000 since 2017
223,000R April 2026 · Highest
Select a bar to inspect its value.
The limit goes up with inflation every April. From April 2026 it is R223,000.
Source: National Treasury · All bars start at zero