Economy · Chart
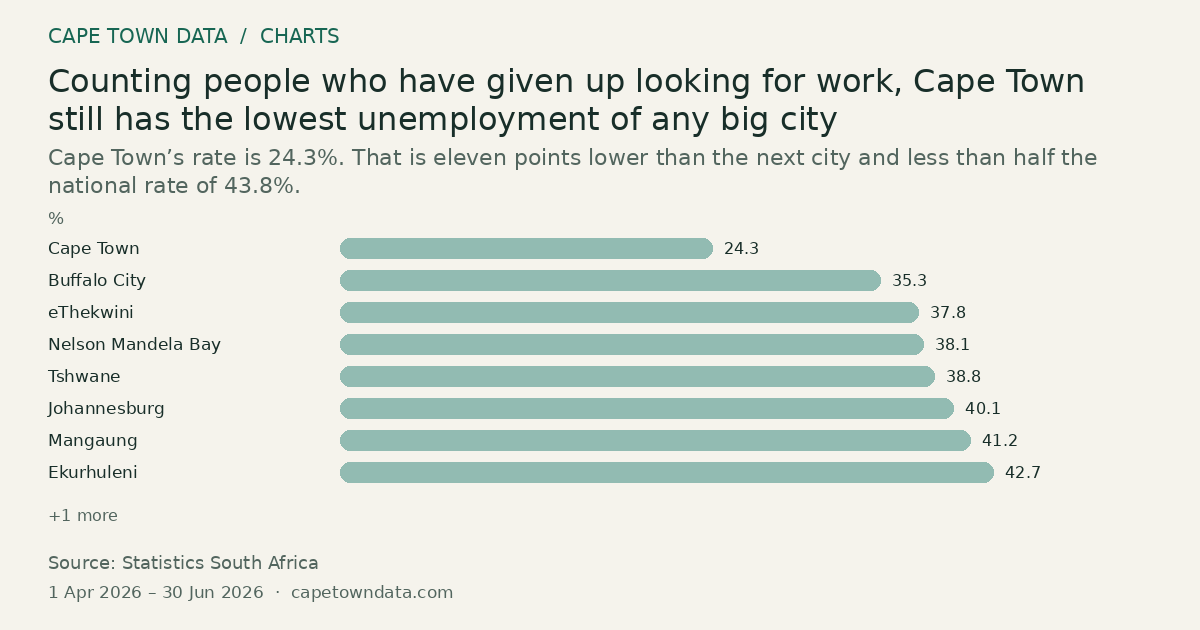
Counting people who have given up looking for work, Cape Town still has the lowest unemployment of any big city
43.8% South Africa, national · Highest
Cape Town’s rate is 24.3%. That is eleven points lower than the next city and less than half the national rate of 43.8%.
 From our storiesWhat are Cape Town biggest challenges in 2026?Read the full story →
Method and sources
Each bar is a metro's broad unemployment rate in the second quarter of 2026, as reported in the article. Stats SA's LU3 measure adds the potential labour force to the unemployed, so it is wider than the strict rate.
Cape Town 24.3%, Buffalo City 35.3%, eThekwini 37.8%, Nelson Mandela Bay 38.1%, Tshwane 38.8%, Johannesburg 40.1%, Mangaung 41.2%, Ekurhuleni 42.7%, South Africa national 43.8%.
The article warns that Stats SA stopped publishing an expanded unemployment rate after the second quarter of 2025, so LU3 figures are not directly comparable with expanded rates quoted before that change.
The period is the survey quarter, 1 April to 30 June 2026.
Sources: Statistics South Africa, Quarterly Labour Force Survey Q2 2026 (P0211), Table 2.3 (https://www.statssa.gov.za/)
Figures as published in our article on Cape Town's biggest challenges in 2026 (chart last checked 14 September 2026): Stats SA Quarterly Labour Force Survey Q2 2026, Table 2.3, LU3 measure. Link to the publisher, not the exact table.
Chart updated · 10 Oct 2026. The observation dates above describe the data, not today’s conditions.
Related charts
The Western Cape took 360,347 of South Africa's 404,712 net new jobs in five years
360,347net new jobs Western Cape · Highest
Select a bar to inspect its value.
Nine in every ten of the country’s extra jobs were in one province, which has about an eighth of the population.
Source: Statistics South Africa · All bars start at zero
Hospitals and specialists take almost two thirds of medical scheme benefits
36% Hospitals · Highest
Select a bar to inspect its value.
Hospitals took 36% and specialists 28%. Together that is almost two thirds of all the money paid out.
Source: Council for Medical Schemes · All bars start at zero
The most a gap cover policy can pay out has risen from R150,000 to R223,000 since 2017
223,000R April 2026 · Highest
Select a bar to inspect its value.
The limit goes up with inflation every April. From April 2026 it is R223,000.
Source: National Treasury · All bars start at zero