Economy · Chart
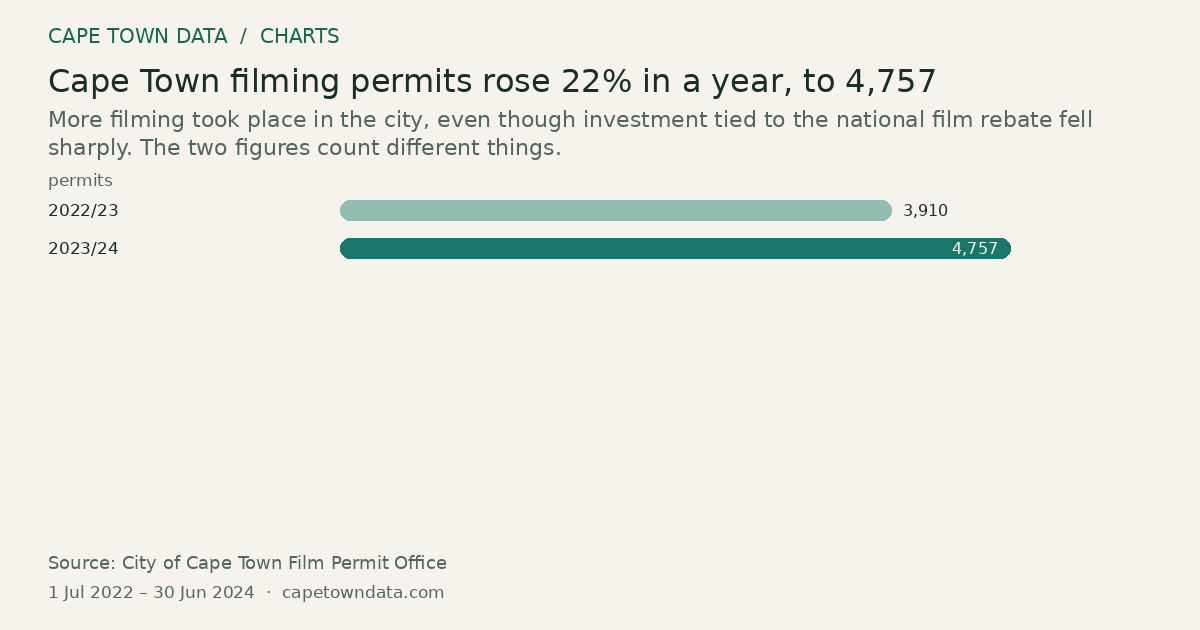
Cape Town filming permits rose 22% in a year, to 4,757
4,757permits 2023/24 · Highest
More filming took place in the city, even though investment tied to the national film rebate fell sharply. The two figures count different things.
 From our storiesCape Town's Film Economy: 2026 Data AnalysisRead the full story →
Method and sources
Each bar is the number of filming permits issued by the City of Cape Town in a financial year, as reported in the article.
2022/23: 3,910. 2023/24: 4,757, which the article marks as up 22% in one year.
This is Panel A of the article's two-panel chart. Panel B, national rebate-linked investment, is credited to industry figures reported by a news outlet and is left out here.
The article notes permit counts include every shoot that needs a street closed, including commercials that never apply for a rebate.
The article gives financial years without exact dates, so the period uses the City's financial year, 1 July 2022 to 30 June 2024.
Sources: City of Cape Town Film Permit Office (https://www.capetown.gov.za/)
Figures as published in our article on Cape Town's film economy (chart last checked 14 September 2026): City of Cape Town Film Permit Office permit counts. The link is to the publisher, not the exact table.
Chart updated · 27 Oct 2026. The observation dates above describe the data, not today’s conditions.
Related charts
The Western Cape took 360,347 of South Africa's 404,712 net new jobs in five years
360,347net new jobs Western Cape · Highest
Select a bar to inspect its value.
Nine in every ten of the country’s extra jobs were in one province, which has about an eighth of the population.
Source: Statistics South Africa · All bars start at zero
Hospitals and specialists take almost two thirds of medical scheme benefits
36% Hospitals · Highest
Select a bar to inspect its value.
Hospitals took 36% and specialists 28%. Together that is almost two thirds of all the money paid out.
Source: Council for Medical Schemes · All bars start at zero
The most a gap cover policy can pay out has risen from R150,000 to R223,000 since 2017
223,000R April 2026 · Highest
Select a bar to inspect its value.
The limit goes up with inflation every April. From April 2026 it is R223,000.
Source: National Treasury · All bars start at zero