Property · Chart
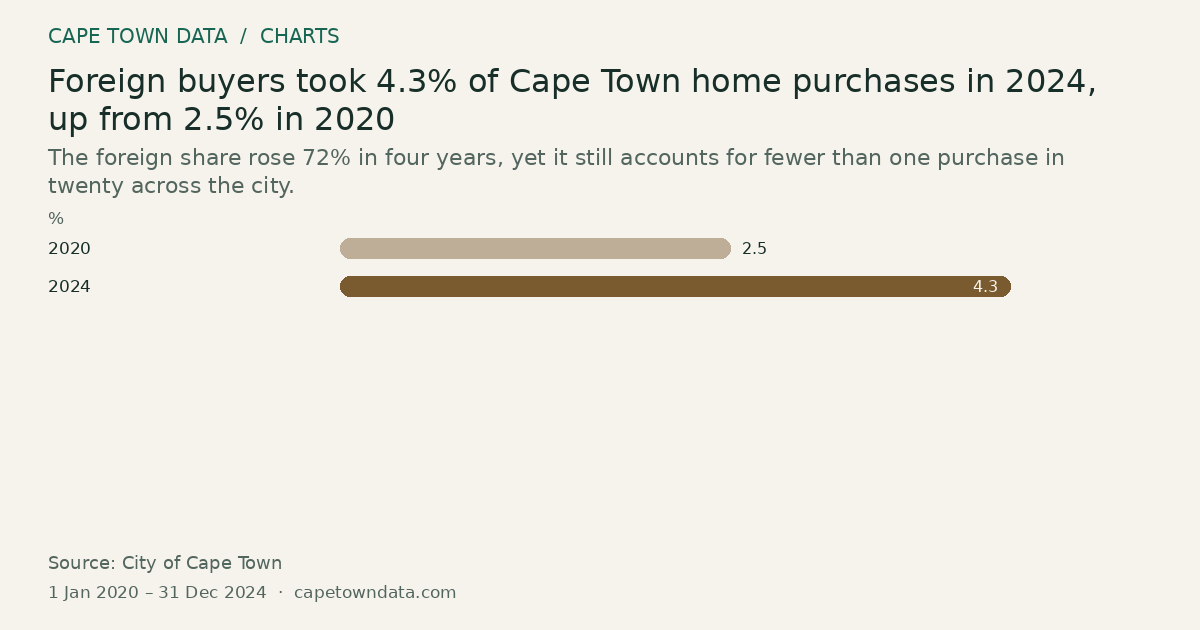
Foreign buyers took 4.3% of Cape Town home purchases in 2024, up from 2.5% in 2020
4.3% 2024 · Highest
The foreign share rose 72% in four years, yet it still accounts for fewer than one purchase in twenty across the city.
 From our storiesHow to Buy Property in South Africa?Read the full story →
Method and sources
Each bar is the share of all Cape Town home purchases made by foreign nationals, as printed in the article's chart.
2020: 2.5%.
2024: 4.3%, which the chart annotates as 72% above the 2020 level.
The article gives years only, so each bar covers 1 January to 31 December of its year.
Sources: City of Cape Town (https://www.capetown.gov.za/) whose deeds data the article credits, as cited by the mayor in 2026. The link is to the publisher, not the exact table.
Figures as published in our guide to buying property in South Africa (chart last checked 14 September 2026): City of Cape Town deeds data, cited by the mayor in 2026.
Chart updated · 16 Oct 2026. The observation dates above describe the data, not today’s conditions.
Related charts
Transfer duty is R33,786 on a R2 million home and R1.24 million on a R13.31 million home
1,241,456R R13,310,000 purchase · Highest
Select a bar to inspect its value.
The tax rises much faster than the price. A home six and a half times more expensive pays nearly 37 times the tax.
Source: South African Revenue Service (SARS) · All bars start at zero
Camps Bay recorded 29 sales above R20 million in a year, more than Bantry Bay and Fresnaye
29sales Camps Bay · Highest
Select a bar to inspect its value.
Cape Town’s sales above R20 million cluster on the Atlantic Seaboard and at the waterfront. Camps Bay alone had almost two in five of these sales.
Source: Seeff Atlantic Seaboard and City Bowl · All bars start at zero
Cape Town house prices grew 11.0% in the year to April 2026, double Johannesburg's
11% Cape Town · Highest
Select a bar to inspect its value.
Cape Town is not only the most expensive big city. Its prices are also rising faster than in the other big cities shown.
Source: Statistics South Africa · All bars start at zero