What is The Best Time to Visit Cape Town - Decoded by Data
April 23, 2026

Best Time to Visit Cape Town: Decoded by Data
Interactive neighbourhood price heatmaps, Atlantic Seaboard rate comparisons, wind-direction beach selection, and a 7-goal scoring matrix across every month of the year. Built from Property24, AirDNA, SA Weather Service and NSRI data.
This guide answers "when should I visit Cape Town?" by letting the data talk. Instead of a generic "summer is best" (which is true for beach lovers and false for almost everyone else), we've built interactive tools that show you what your trip actually costs, what you'll see, and which neighbourhoods fit your budget for the specific dates you're considering. The short version: late March to May or September to November wins for most travellers. But the full picture depends on whether you've come for Clifton sand, Hermanus whales, Namaqualand flowers, winter truffle menus, or just the cheapest week possible.
The best time to visit Cape Town, by trip goal
Cape Town runs on a Mediterranean calendar: warm, windy, expensive summers and cool, wet, cheap winters. Between them, two shoulder windows deliver the best balance of weather and value. Pick the card that matches why you're coming.
Interactive price heatmap: where to stay, by month
Each circle is a neighbourhood; size and colour scale with median nightly accommodation rate. Tap any circle to see its off-peak to peak range. Use the month buttons to watch prices shift across the year: Clifton's December rate is roughly 2.2× its June rate, while Woodstock's premium is closer to 2×. The geographic pattern stays constant: Atlantic Seaboard commands a huge premium over False Bay and the Southern Suburbs, regardless of season.
Cape Town accommodation prices
Median ZAR/night across hotels and Airbnb (AirDNA 2026, Property24)
Atlantic Seaboard: rate by neighbourhood and season
The Atlantic Seaboard commands Cape Town's highest accommodation premium because you're paying for two things: sea views and the Cape Doctor's rain shadow (summer rainfall is near zero). Within the strip, pricing stratifies sharply by prestige. Clifton's peak rates approach luxury-Maldives territory; Sea Point and Green Point deliver the same sunsets for less than half the price.
Clifton: the benchmark
Peak R14,000/night (€730 · $850), off-peak R6,500 (€340 · $400). The 2.15× ratio means off-peak Clifton is cheaper than peak Bantry Bay. If you want Clifton on a shoulder budget, May and September are the value windows.
Camps Bay: the midpoint
R4,500–R11,500 range (€235–€600 · $275–$700). Best absolute value within the glamour strip. Beach-facing studios in winter run below R3,500 (€180 · $215) on Airbnb; impossible in December.
Sea Point: best value
R2,200–R4,800 (€115–€250 · $135–$295). You get the Promenade, restaurants, and the same ocean views for ~40% of Clifton pricing. Hotel inventory here is the deepest on the Seaboard.
Green Point & V&A
Green Point (R2,000–R4,200 · €105–€220 · $120–$260) is the car-free base. V&A Waterfront pricier (R3,800–R8,500 · €200–€440 · $230–$520) but inside the tourist hub.
Month dashboard: all the numbers at once
Rather than scrolling through 12 separate month write-ups, tap a month below to see everything that matters: temperature, rainfall, wind intensity, crowd volume, relative pricing, sea temperature and whale-sighting probability, all in a single view.
The fit matrix: your trip goal × every month
Seven trip types, twelve months, one grid. Each cell scores how well that month fits that goal, from 0 (bad fit) to 10 (ideal). Scan horizontally to find your best months; scan vertically to see which month does the most things at once. October is the only month that scores ≥7 on four of the seven goals, which is why it gets so many first-time-visitor recommendations.
Weather patterns: the Mediterranean signature
Cape Town's climate is Mediterranean (Köppen Csb): warm, dry summers and cool, wet winters. The temperature swing is modest: the city's maritime position means summer highs rarely hold above 30°C for long, and winter lows almost never approach freezing. What varies dramatically is rainfall and wind. June averages 95mm of rain across 10 rainy days; February averages 8mm across 2. The Cape Doctor south-easter peaks November–February and delivers gusts of 70–90 km/h on "pumping" days.
The wind tool: pick a beach for today's forecast
The single most useful piece of local knowledge in Cape Town: check the wind direction before committing to a beach. The Cape Peninsula's geography splits the coast into two windward-leeward zones separated by Table Mountain and Lion's Head. On south-easter days (most of summer), False Bay is calm while Camps Bay is being sandblasted. On north-wester days (mostly winter storms), the reverse applies. Tap a direction below to see which beaches work.
South-easter (Cape Doctor)
Cape Town's dominant summer wind. Atlantic Seaboard gets hammered; False Bay stays calm thanks to mountain shelter.
Sheltered beaches:Whales & wildflowers: probability by week
Two signature Cape experiences run on natural, weather-dependent calendars that don't care about tourism pricing. The curve below shows weekly probability of meaningful whale sightings in Walker Bay and False Bay, alongside Postberg wildflower bloom quality (the reserve is only open 1 August to 30 September). Peak whale week is mid-to-late September. Peak flower week is a fortnight earlier, around late August.
Month by month: the honest trade-offs
January
26°C / 16°C · 12mm · wind 10/10The hottest, driest, busiest, and windiest month. Peak south-easter means cable-car closures and sandblasted Atlantic beaches. Book months ahead; expect full peak pricing (R14k Clifton / R4.2k Green Point).
February
27°C / 16°C · 8mm · wind 9/10Warmest and driest of the year. Slight pricing reprieve after mid-month as SA school holidays end. Beaches still the main event.
March
25°C / 15°C · 18mm · wind 7/10Locals' favourite. Still warm, visibly calmer. Cape Town Cycle Tour in early March; wine harvest season. Prices down ~35% from Dec.
April
23°C / 13°C · 45mm · wind 5/10Mild, versatile, first real winter rains creep in toward month-end. Two Oceans Marathon (Easter). Excellent hiking weather; golden-hour light is exceptional.
May
22°C / 11°C · 70mm · wind 4/10Restaurant winter specials begin. Some days still feel like summer; others bring cold fronts. Prices already down ~55% from peak.
June
18°C / 9°C · 95mm · wind 3/10Winter proper. Wettest month, ~95mm across 10 rainy days. Southern right whales arrive 1 June. Flights from Europe up to 50% cheaper; hotels at seasonal floor (Clifton R6,500 €340 · $400 vs peak R14,000 €730 · $850).
July
17°C / 8°C · 85mm · wind 3/10Coolest month. Best surf conditions. Table Mountain cable car closes for ~1 week maintenance; verify dates before booking. Kruger safari is in prime dry season for pairing.
August
18°C / 9°C · 75mm · wind 4/10Postberg opens 1 August. Peak whale-and-flower window late month. Still winter pricing; spring beginning to whisper.
September
19°C / 10°C · 40mm · wind 6/10Single most photogenic month. Wildflowers peak, whales near peak, Kirstenbosch in spring bloom. Prices still 40% below peak.
October
21°C / 12°C · 25mm · wind 7/10The best all-rounder. Warm enough, dry enough, whales present, prices still moderate. Meaningfully cheaper than November. Beat the crowds and pricing that arrive mid-November.
November
23°C / 14°C · 18mm · wind 9/10Warm shoulder. Cape Doctor ramps up aggressively. Hotels transition to high-season rates ~15 Nov. Christmas surge still weeks away.
December
25°C / 15°C · 12mm · wind 9/10Festive, busy, windy, expensive. Flights and hotels ~50% above shoulder. Mid-Dec to mid-Jan is peak within peak; book 3 months out for anything reasonable.
Frequently asked questions
Sources & Methodology
- Pricing data: AirDNA Cape Town Market 2026, Africanvestor Cape Town Airbnb analysis, Property24 listings (April 2026 pull), Tripadvisor / Expedia seasonal pricing trends, Cape Villa Collection published season schedules
- Climate data: SA Weather Service long-term normals (1991–2020), Weather Spark Cape Town, Climates to Travel, Weather Atlas Cape Town (sea temperature series from Sunheron)
- Wind & Cape Doctor: Time Out Cape Town (Nov 2025), The Fynbos Guy, Cape Town Magazine, Grokipedia Cape Doctor reference, Windfinder historical
- Whale data: Southern Right Charters sighting logs, Hermanus Whale Watchers, WWF whale-watching destination rankings, Whale Hermanus season calendar
- Flower data: SANParks West Coast National Park Flower Season guide, Cedarberg Travel flower viewing 2026, Namaqua National Park bloom reports
- Visitor volumes: capetowndata.com Cape Town Tourism 2026 report, Cape Town International Airport passenger statistics 2025
You May Also Like
How to Buy Property in South Africa?
Property Guide · South Africa What You Need to Buy Property in South Africa South Africa is one of the most open property markets in…
Read Article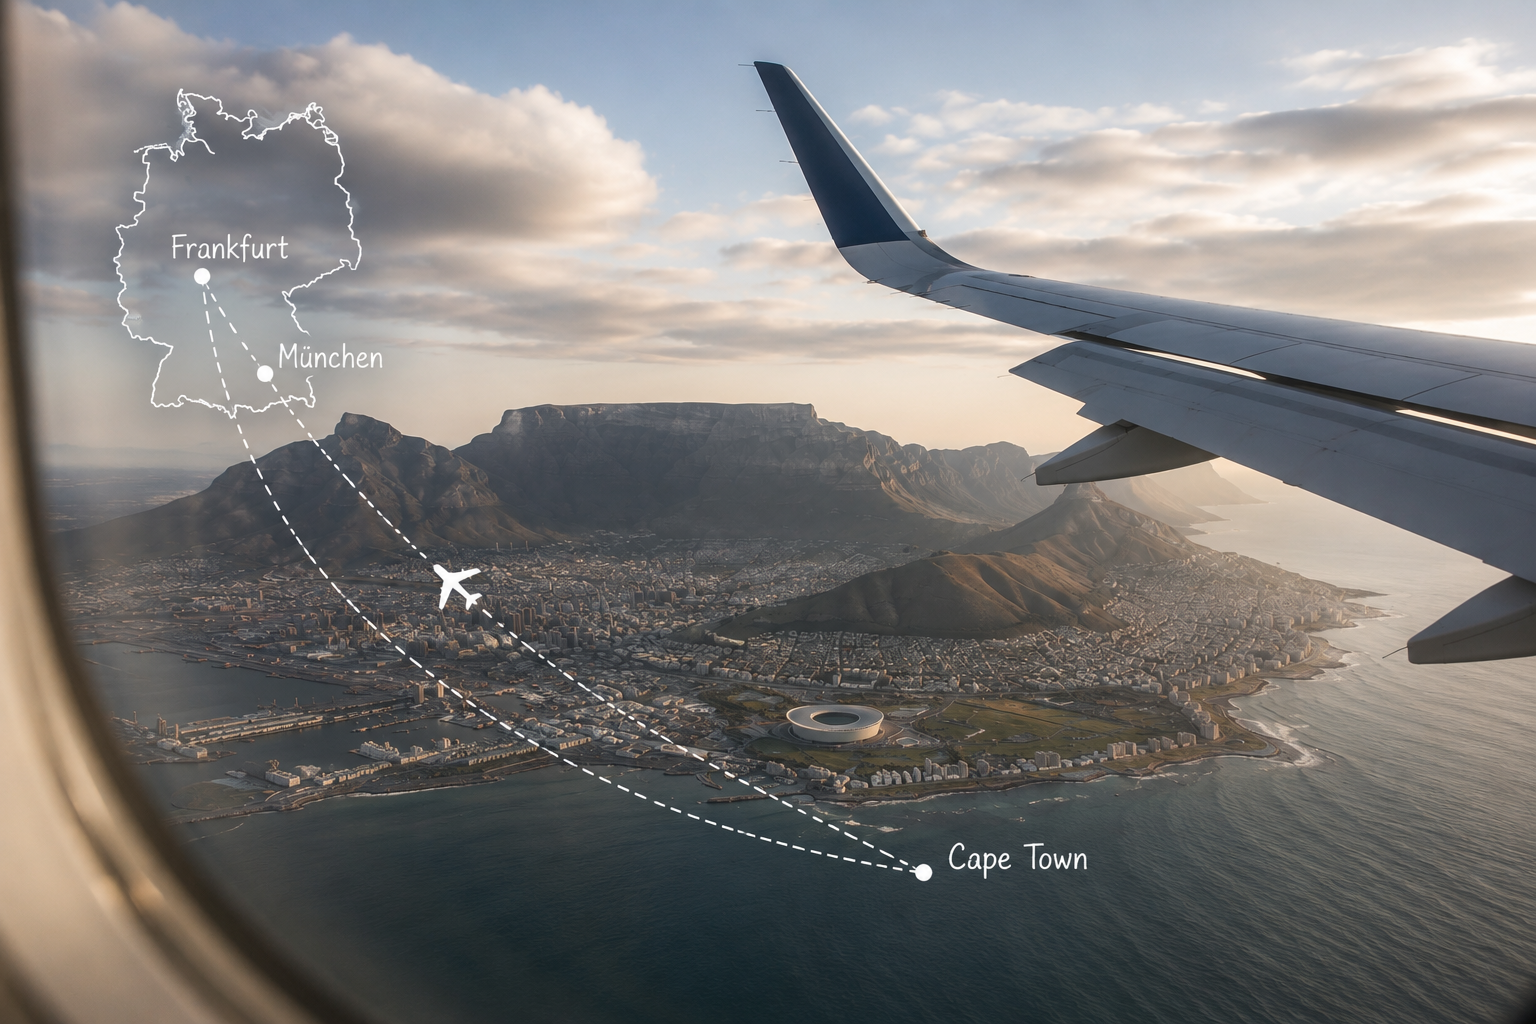
What are the best routes to fly from Germany to Cape Town?
Travel Economics · Germany to Cape Town Flights from Germany to Cape Town: Best Routes, Prices and Times Two German airports fly nonstop to Cape…
Read Article
What’s up with South African credit rating?
Hero image: “Johannesburg Hillbrow” by NJR ZA, sourced from Wikimedia Commons , licensed under Creative Commons Attribution-ShareAlike 3.0 (CC BY-SA 3.0) . No changes were…
Read Article
Is the Rand weakening? What drives the South African currency?
Hero image: “Johannesburg Hillbrow” by NJR ZA, sourced from Wikimedia Commons , licensed under Creative Commons Attribution-ShareAlike 3.0 (CC BY-SA 3.0) . No changes were…
Read Article
The Reserve Bank just raised rates. Here is why that was a difficult decision
Money & Policy · Explainer The Reserve Bank just raised rates. Here is why that was a difficult decision. On 28 May 2026 the South…
Read Article