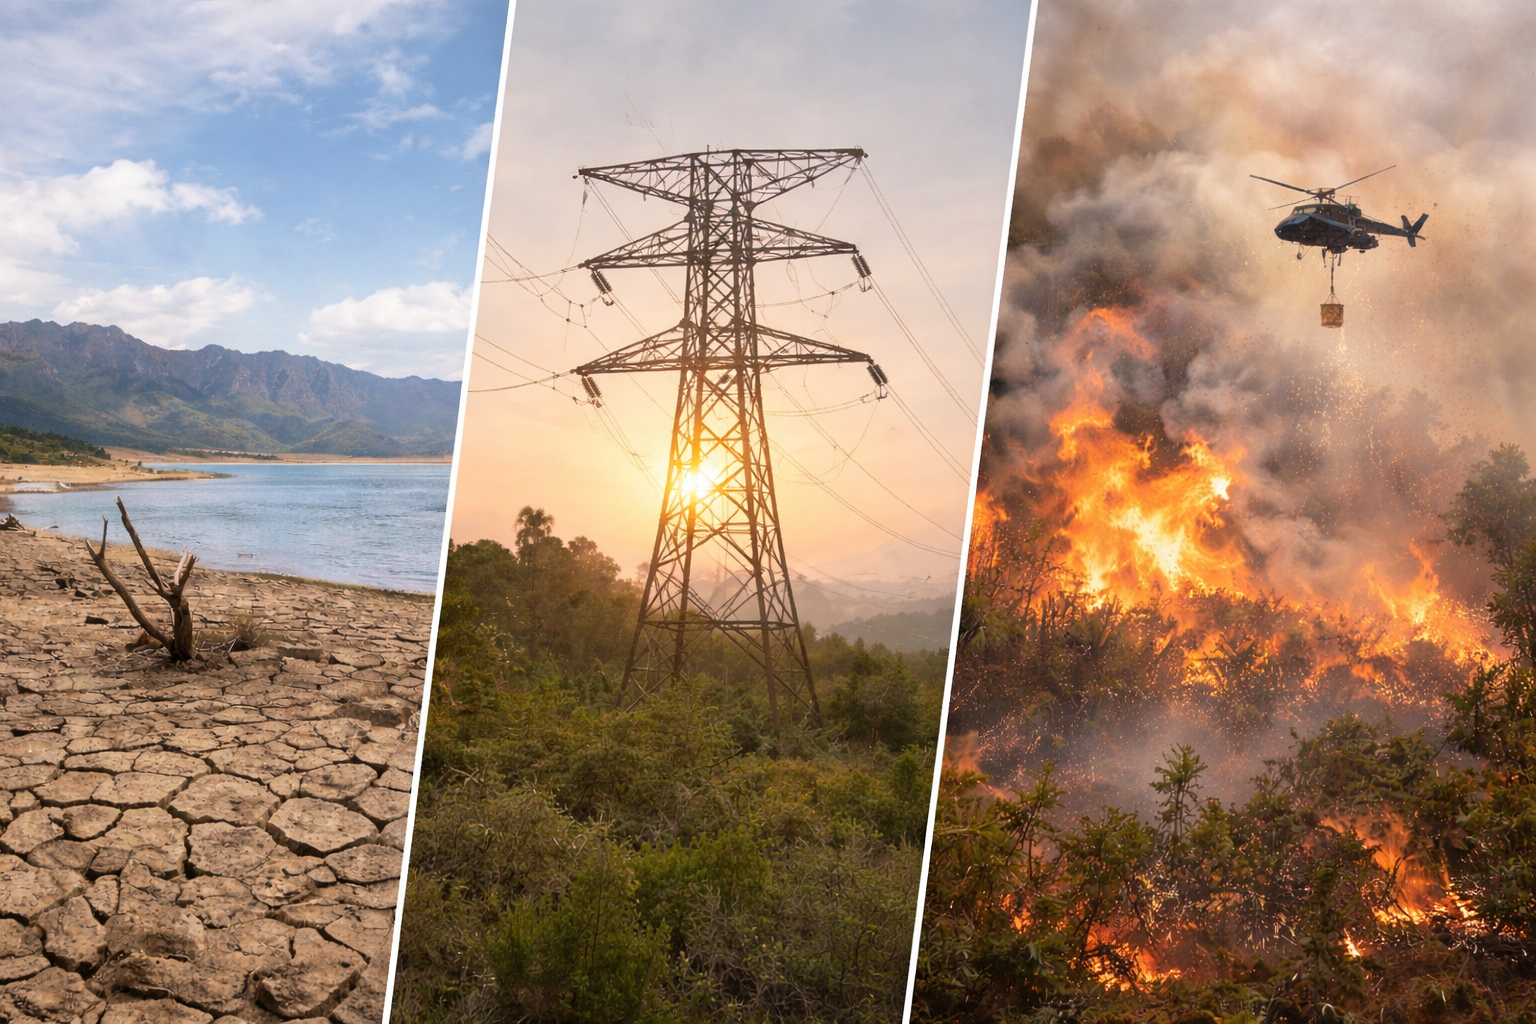
Cape Town Autumn Wrap 2026: loadshedding, fires and water supply
April 11, 2026
Cape Town Autumn 2026: Dams, Power & Fires in Numbers
Three datasets, one picture of the end of summer. Water is the problem, electricity is the surprise, fire is the warning.
Dams: down sharply, not yet a crisis
Cape Town's combined dam system stood at 47.2 percent on 2 April 2026 according to the Western Cape Government dam dashboard. That figure hides a much sharper story. On the same week in 2025 the system was at roughly 67 percent. The city is therefore carrying almost 20 percentage points less water into the winter rainy season than it was a year ago. To put 47 percent in historical context: it is well above the Day Zero trough of 13.5 percent in early 2018, but well below the 95 percent peak reached in October 2020 after two strong winters.
Cape Town combined dam levels: April reading, 2018 to 2026
The decline accelerated from February onwards. On 2 February 2026 combined levels were still at 60.1 percent, down from 62.2 percent the week before and 80.3 percent a year earlier according to City of Cape Town and Department of Water and Sanitation data reported by The Citizen. By mid-March (week 12) the Cape Town system stood at 49.8 percent versus 66.9 percent in the same week of 2025. The trajectory is not a Day Zero trajectory, but it is the steepest early-autumn decline since 2018.
Theewaterskloof carries 41 percent of the entire Western Cape Water Supply System and is the dam that matters most. It held 48.4 percent in week 12 of 2026 versus 67.4 percent in the same week of 2025 per the EGVV weekly water dashboard. This remains comfortably above the 2018 Day Zero lows near 13 percent, but the early drought caution issued by the City in its weekly dashboard is the appropriate framing. Winter rains between May and August will decide whether 2026 ends looking like a dry cycle or a genuine supply problem.
Major Dam Levels: 2026 vs 2025 (same week)
Theewaterskloof carries 41 percent of the entire Western Cape Water Supply System and is the dam that matters most. It held 48.4 percent in week 12 of 2026 versus 67.4 percent in the same week of 2025 per the EGVV weekly water dashboard. This remains comfortably above the 2018 Day Zero lows near 13 percent, but the early drought caution issued by the City in its weekly dashboard is the appropriate framing. Winter rains between May and August will decide whether 2026 ends looking like a dry cycle or a genuine supply problem.
Load shedding: the quiet revolution
While water falls, the lights stay on. As of 12 January 2026 Eskom reported 288 consecutive days without load shedding, the longest uninterrupted supply streak in over five years, dating back to before the Stage 6 outages of 2022 and 2023. By early April 2026 the streak has extended past 380 days. The scale of the turnaround is hard to overstate when you put 2026 next to the years that came before it.
South Africa load shedding hours per calendar year, 2020 to 2026
2023 alone produced 6,947 hours of load shedding, the equivalent of 79 percent of the year, with significant portions at Stages 5 and 6. South Africans spent more days without power in 2023 than in the previous nine years combined. The Generation Recovery Plan launched in April 2023 turned that line around. The Energy Availability Factor hit 69.1 percent in December 2025, up 12.6 percentage points year on year from 56.6 percent. Unplanned outages fell to 6,822 MW in late December 2025, less than half the 12,328 MW recorded the previous year.
Ratings agencies have noticed. Moody's and S&P cited improved energy stability as a factor in South Africa's first sovereign credit rating upgrade in two decades. Third-quarter 2025 GDP grew 0.4 percent after a 1.9 percent expansion in Q2, growth that economists attribute in large part to the end of rolling blackouts. For Cape Town businesses, the streak is the difference between budgeting for diesel generators and budgeting for expansion.
Fires: the worst season in a decade
The Western Cape 2025 to 2026 fire season was the most destructive in ten years. Provincial disaster management put the total burned area above 132,000 hectares by 26 January, with the season still running. For context, a typical Western Cape fire season averages roughly 50,000 to 80,000 hectares burned across the province. The 2025 to 2026 figure is more than double that average and the highest aggregate since the catastrophic 2015 to 2016 season. Fire incident counts ran 5 to 16 percent above the five-year average. Forty-five structures were destroyed. Nearly 7,000 people were displaced. Cabinet was formally asked to consider a disaster declaration.
The headline incident was the Franschhoek fire cluster. A blaze that began in the Langrug area on 7 January 2026 burned approximately 17,000 hectares in its first week, then reignited and by 26 January had torched 23,500 hectares. Mont Rochelle Reserve's trail network suffered severe damage. Both bridges on the Uitkyk route were destroyed. The fire crossed the Berg River, historically a natural firebreak, overnight on 20 January as winds hit 50 km per hour and grounded aerial suppression. Aerial firefighting operations across the province logged 38 missions in January alone, with the provincial government spending R15 million on aerial resources.
Western Cape 2026 fire season: headline numbers
The Overstrand alone reported 33,000 hectares burned at Pearly Beach and a further 4,000 at Stanford, with firefighting costs estimated between R6 million and R7 million since 4 January. A separate lightning-ignited blaze in the Keurbooms-Soetkraal area of Garden Route National Park consumed roughly 10,000 hectares in remote terrain. The Cederberg Wilderness Area was closed to hikers from 13 to 26 January as mop-up crews worked.
Three datasets, one chart
If you ask the right question, the three datasets fit into a single scatter plot. The question: do years with lower dam levels also have worse fire seasons? Each dot below is one year between 2018 and 2026. Position on the horizontal axis shows April dam levels. Position on the vertical axis shows hectares burned that fire season. Bubble size and colour together encode load shedding hours that year: tiny green dots are years with a stable grid, large dark-red dots are years dominated by power cuts. The 2023 bubble is the largest and darkest because 2023 was the worst year on record for load shedding. The 2026 bubble is small and deep green because the grid has held all year.
2026 broke the pattern: drier dams, worse fires, even with the grid finally stable
The chart asks one question and answers it without ambiguity. Look at where 2026 sits: alone in the danger zone, far away from the comfortable 2020 to 2024 cluster on the right. The dot is small and green because the grid has held all year — that part is genuinely good news. But the position of that green dot is the worst position any year has held in the entire dataset. Lower dam levels than any year since 2019, and the largest burned area on record, in the same year. Every other year between 2018 and 2024 had at least one of the three dimensions going right. 2026 is the first year where two of three are simultaneously bad and the third (load shedding) is no longer the variable that matters most.
The three together: what the data says
Read individually, each dataset tells a different story. Read together, they describe a specific kind of autumn. Water is under pressure and the next ninety days of rainfall will matter enormously. Electricity has quietly become reliable infrastructure again after a decade of crisis framing. And the fire season proved that climate-era summers in the Western Cape will keep producing worst-in-a-decade events with uncomfortable frequency.
The correlation that matters: low dams and active fires share a common driver, which is below-average rainfall combined with sustained high temperatures and wind. If winter 2026 delivers normal rainfall, dams recover and the 2026 to 2027 fire season starts from a safer baseline. If it does not, Cape Town begins summer 2026 to 2027 with drier catchments, drier fuels, and the same structural wind patterns that drove Franschhoek.
Where it all happened: the autumn 2026 map
The fires and the dams share one map. Reading them side by side shows the geographic logic of the season: the Franschhoek fire ignited in the same Berg River catchment that feeds the Berg River Dam and sits a short ridge away from Theewaterskloof, the system's largest reservoir. The Overstrand fires at Pearly Beach and Stanford burned well outside the city water catchments but consumed the largest single area of the season. Signal Hill's January reignition serves as the reminder that the metro's own fire risk is not theoretical.
Seven major fires and five major dams of the 2025 to 2026 summer season. Red pins mark fires of 10,000 hectares or more. Blue pins show dam levels as of week 12 of 2026. Tap any pin for details and directions.
Frequently asked questions
Is Cape Town heading for another Day Zero?
How reliable is the current load-shedding streak?
Why was the 2026 fire season so bad?
Are these three datasets connected?
Sources & references
• Western Cape Government, "Latest Western Cape dam levels" (2 April 2026 figure: 47.2%)
• City of Cape Town, "This week's dam levels" — weekly dashboard
• City of Cape Town Weekly Water Dashboard PDF (PDF) — drought caution statement
• EGVV Region, "Dam Levels Week 12/2026" — Theewaterskloof 48.38%, Cape Town system 49.80%
• The Citizen, "Cape Town dam levels continue to drop" (2 Feb 2026)
• The Citizen, "Cape Town dam levels drop as water reserves continue to fall" (18 Feb 2026)
• Wikipedia, "Theewaterskloof Dam" — capacity 480,406 ML, 41% of WCWSS
• Department of Water and Sanitation, "Provincial State of Dams — Western Cape"
Load shedding & Eskom performance
• Eskom, “Power system remains stable” press release (2 Jan 2026) — EAF 69.14%, unplanned outages 6,662 MW, 231 consecutive days
• Eskom, “Power system status” weekly update (26 Dec 2025) — EAF 67.55%, 224 consecutive days
• Eskom, “Festive season demand” update (12 Dec 2025)
• Bloomberg, “Eskom Keeps Lights on for 231 Straight Days” (2 Jan 2026)
• Central News SA, “Eskom Enters 2026 with Strongest Power System in Five Years, Ending 288 Days Without Load Shedding” (13 Jan 2026)
• The Citizen, “Eskom powers through 2025 with minimal load shedding” (23 Dec 2025) — Summer Outlook commitments
Fire season
• Time Out Cape Town, “UPDATE: Franschhoek Pass closed, firefighting efforts continue” (23 Jan 2026) — 23,500 ha figure
• South African Government, “Deputy Minister Narend Singh visits fire incident command post” (16 Jan 2026) — 17,000 ha official figure, Langrug origin 7 Jan
• EWN, “Cape Winelands mayor says recent fires deeply impacted communities” (13 Jan 2026)
• Bolander Lifestyle, “Damage and cost assessments underway after Franschhoek wildfire contained” (16 Jan 2026)
• NovaNews, “Western Cape spends R15m on aerial firefighting” — 90,000 ha figure, 45 structures, 38 aerial missions
• Food For Mzansi, “Western Cape fires destroy farmland and livelihoods” — Pearly Beach 33,000 ha, Stanford 4,000 ha, R6 to R7m costs
• Voice of the Cape, “Wildfires Rage in Cape Winelands as Wind Drives Flames” (20 Jan 2026) — Berg River crossing, 50 km/h winds
• Cape Town Etc, “Franschhoek fires mostly contained” (10 Jan 2026)
Real-time fire tracking & emergency resources
• CapeNature reserve alerts — trail closures
• SANParks Table Mountain fire management — fire season window Nov to May
• Emergency: 107 (Cape Town PECC) · 021 480 7700 · Table Mountain fires: 086 110 021
You May Also Like

Cape Town Energy Update April 2026: Fuel Shock, No Loadshedding, and the New Solar Rules
Photo courtesy of Dietmar Rabich, Wikimedia Commons, licensed under CC BY-SA 4.0 Energy & Infrastructure · April 2026 Fuel Shock, No Loadshedding, and the New…
Read Article
What is going on with South Africa's electricity?
Photo: Robosk, CC BY-SA 4.0, via Wikimedia Commons Updated February 2026 South Africa's Electricity: From Crisis to Recovery After years of crippling blackouts, South Africa…
Read Article
What is Cape Town's Loadshedding about?
Cape Town • Practical Guide • Electricity & Outages ✅ National status: Not load-shedding (check live) Load-shedding in Cape Town (2026): what’s the situation and…
Read Article