What are Cape Town biggest challenges in 2026?
March 29, 2026
Cape Town's Biggest Challenges in 2026
Ranked the world's 6th best city and its most beautiful, while dam levels plunge, housing costs soar, and a million residents live in informal settlements. The Mother City's five defining contradictions, told through data.
Cape Town's five biggest challenges, ranked by urgency
From the most immediately pressing to the most structurally deep.
Ranking reflects editorial assessment based on immediacy and severity of impact. All five challenges are interconnected.
The Cape Town Paradox
Spend a week in Cape Town and you will hear the same two phrases on a loop: "I love this city" and "I have no idea how anyone can afford to live here." They capture the essential contradiction of the Mother City in 2026. On the surface, it is a place in ascent, ranked 6th in Time Out's Best Cities list, drawing 2.4 million overnight tourists and R24.5 billion in direct spending in 2024, adding 113,000 jobs year-on-year by Q4 2025, and posting an employment record that no other South African metro can match.
But the data tells a more complicated story. Beneath the wine-farm weekends and postcard mountain views lies a city grappling with structural challenges that are deep, interconnected, and for many of its residents, getting worse.
Four numbers that define Cape Town's paradox. Sources: Time Out, City of Cape Town, Stats SA, World Bank.
These five challenges (water, inequality and housing, crime, economic exclusion, and climate vulnerability) are not discrete issues. They are woven together in ways that compound each other. A family in Khayelitsha contending with gang violence is also dealing with housing insecurity, limited access to clean water infrastructure, and low prospects for formal employment. A semigrant professional in Sea Point grappling with rising rents and property valuations is also funding a growing municipal budget under strain.
What follows is a challenge-by-challenge breakdown, grounded in the most recent available data. The picture is neither uniformly grim nor naively optimistic. It is complicated, as any honest portrait of a deeply contested city must be.
CriticalChallenge 1: Water Security, the Slow Emergency
Cape Town almost ran out of water once before. In 2018, during the "Day Zero" crisis, dam levels fell below 15% and residents were restricted to 50 litres per person per day. The city narrowly avoided becoming the first major urban centre in the world to switch off its municipal supply. Eight years later, water is back in the headlines.
Source: City of Cape Town Weekly Water Dashboard, DWS. Data as of late March 2026.
The chart tells the story that numbers alone cannot. The 2025 line (purple) shows where the city was last year at this point: a comfortable 68% heading into autumn. The 2026 line (teal) sits nearly 20 points below, and the slope is steepening. If the current rate of decline continues without meaningful rain, the projected path (red dashed) reaches 40% by May. That is not crisis territory, but it is the zone where formal water restrictions become likely.
The demand side matters just as much. Consumption recently spiked above 1 billion litres per day during the heatwave, more than 80 million litres above the City's 975 MLD target. The practical question for Cape Town residents: can usage stay below target for long enough that the first winter rains in May or June arrive before the buffer runs out?
Dam levels: the downward slide since October
Source: City of Cape Town Weekly Water Dashboard, DWS dam-level reports, IOL/Cape Argus reporting.
Since December 2025, dam levels have been declining by about 2 percentage points each week. Daily consumption has been running above 1,000 million litres per day, well above the City's target of 975 MLD. Theewaterskloof Dam, the largest in the system, has dropped from over 53% to around 52%.
The City's modelling suggests that if consumption stays high and winter rainfall is merely average, dam storage could dip to around 40% by May. A UCT climatologist has warned of worst-case scenarios in which levels could fall to 30%. The South African Weather Service has flagged that the upcoming winter rainfall season may be drier than normal, adding urgency to conservation calls.
Why is this happening again?
Several factors have converged. Cape Town's population has grown by roughly 400,000 since 2020, with 76% of those new residents falling into the low-income bracket. Per-capita water use has crept upward from the post-drought lows, when residents briefly hit 50 litres per day during the crisis, but average use over the past 12 months sits at roughly 160 litres per day, while sustained heatwave conditions through late 2025 and early 2026 have driven up both household demand and evaporation from the dams. The system also loses approximately 23% of its water through leaks and unaccounted-for use.
Source: City of Cape Town estimates. ~70% of supply goes to households; ~23% is lost to leaks and unmetered use.
What's being done?
Unlike 2018, the City now has a range of infrastructure responses in motion. The New Water Programme aims to add up to 300 million litres per day by 2031 through a combination of desalination (a major foreshore plant), water reuse (the Faure New Water Scheme, which will add up to 70 million litres per day), and expanded groundwater abstraction. The City has also replaced 367 km of ageing water pipes since 2019 and expanded pressure-management systems across the network.
Then
Dam levels below 15%. Residents restricted to 50L/day. No alternative water sources. Emergency desalination plants hastily commissioned. Cost per unit prohibitive.
Now
Dam levels ~50%. No restrictions yet. 367 km of pipes replaced. Groundwater, reuse, and desalination projects underway. But still years from full delivery. Consumption exceeding targets.
Challenge 2: Inequality & the Housing Crisis
If the water challenge is a slow emergency, inequality is the permanent condition. South Africa is the most unequal country in the world by income distribution, with a national Gini coefficient of 0.63. Cape Town mirrors this almost exactly. The richest 10% of South Africans hold 71% of the wealth; the bottom 60% hold just 7%.
In Cape Town, this inequality is written into the landscape. The city's spatial structure, with affluent, leafy suburbs pressed against Table Mountain and the coastline while sprawling townships and informal settlements occupy the flat, wind-swept Cape Flats, still reflects the architecture of apartheid more than three decades after its end.
Source: IMF, World Bank. The top 10% of South Africans hold 71% of national wealth. The bottom 60% hold 7%.
The housing squeeze, in numbers
Cape Town's property market is simultaneously the envy of South Africa and a source of deep anxiety for ordinary residents. Property prices in the metro rose by 10% year-on-year in October 2025, far outpacing the national increase of 6.8%. The average sales price now exceeds R2 million, while Johannesburg's average sits around R1.35 million. Prime coastal areas command extraordinary premiums: Clifton, Camps Bay, and Bantry Bay range from R70,000 to R180,000 per square metre, up to seven times the metro average.
Cape Town vs Johannesburg: the price gap
Source: Stats SA RPPI, Lightstone, FNB Property Barometer, es-capetown.com housing analysis.
For the city's working-class residents, the numbers are even more sobering. A typical R2.5 million home with a 10% deposit and a 20-year bond at current interest rates costs roughly R21,000 per month before rates and levies. That puts formal homeownership out of reach for most middle-class households, let alone the 57.9% of Cape Town's population living below the upper-bound poverty line.
Three forces tightening the market
Semigration
An estimated 500,000 people will have migrated to the Western Cape between 2021 and 2026, according to StatsSA. Skilled professionals from Gauteng bring higher purchasing power, pushing prices in desirable suburbs beyond the reach of local earners.
Short-Term Rentals
Airbnb and similar platforms have removed thousands of long-term rental units from the market. In February 2026, the City announced plans for a 135% rates increase on short-term rental properties, reclassifying them as commercial operations, a direct attempt to slow the conversion of residential housing stock.
Foreign Capital
Foreign buyers accounted for roughly R2.8 billion (about a quarter of the R11.3 billion) in property sales on the Atlantic Seaboard and City Bowl in the past year, according to Seeff Property Group. The digital nomad visa, introduced in 2024, has further accelerated foreign demand.
Supply Bottleneck
New housing construction cannot keep pace with demand in desirable areas. Scarce developable land (mountain and ocean limit supply), lengthy approval processes, and infrastructure capacity constraints make large projects slow and expensive. The City delivered 12,401 affordable units in five years, a better record than any other metro but far below the 600,000+ waiting-list backlog.
Challenge 3: Crime & Safety
Crime in Cape Town is concentrated, not evenly distributed. Understanding that geography is essential to understanding the city's safety challenge. Cape Town Central police station was ranked number one in the country for community-reported serious crimes in Q3 2025/26. Six other Western Cape precincts also featured in the national top 30.
The province recorded 1,157 murders between October and December 2025, a decrease of 41 cases compared to the same period the previous year. That modest improvement matters, but it still represents an extraordinary level of violence by any international standard. The majority of these murders are linked to firearms, gang activity, and interpersonal disputes concentrated on the Cape Flats.
LEAP Areas: Murders Down
In the combined LEAP deployment areas (Delft, Gugulethu, Khayelitsha, Mitchells Plain, Nyanga, and Philippi East) the murder rate fell by 3.7% in Q3 2025/26. Mitchells Plain saw a 22% drop, Delft a 19.4% drop. The provincially funded programme is producing measurable results.
Other Serious Crimes Rising
While murders declined slightly, the latest quarterly data shows troubling increases in several other serious crime categories, including common robbery, aggravated robbery, and commercial crime. Property crime and carjacking remain persistent concerns in suburban areas.
Q3 2025/26: what moved in the Western Cape
Source: SAPS Q3 2025/26 Crime Statistics, Western Cape Government briefing Feb 2026. Green = decrease; red = increase.
The two-city problem
Cape Town's crime landscape is best understood as a tale of two cities. In the 2026 Numbeo Crime Index, the five worst-ranking South African cities for crime were Pietermaritzburg, Pretoria, Johannesburg, Durban, and Gqeberha. Cape Town was not among them. This is because crime in Cape Town occurs predominantly in a small list of specific suburbs and is driven overwhelmingly by gangsterism, whereas crime in Johannesburg is more diffused across the metro.
For residents of suburbs like Camps Bay, Constantia, Newlands, or Tamboerskloof, the lived experience of safety is generally high. Private security, active community policing forums, LPR camera networks, and city improvement districts create a layered safety infrastructure. For residents of Nyanga, Khayelitsha, Manenberg, or Delft, the reality is fundamentally different: gang territories, gun violence, inadequate street lighting, overcrowded informal settlements, and under-resourced police stations.
What's driving the violence?
The provincial police commissioner identified several causal factors in a December 2025 briefing: gang violence, taxi violence, arguments and revenge attacks, extortion, and gender-based violence. These operate in areas characterised by dense informal settlements, high unemployment, cramped municipal housing, and limited youth diversion programmes. Drug-related crime in Cape Town averages 19 times the murder rate and nine times the rate of reported sexual offences, a statistic that underscores how the narcotics economy fuels the broader crime ecosystem.
The long view: total crime per 100,000 has fallen sharply
Source: Cape Town 2050 Long-Term Plan. Total crime per 100,000 population, all categories.
Challenge 4: Jobs & the Dual Economy
The headline numbers are genuinely impressive. Cape Town's unemployment rate dropped to 19.8% in Q4 2025, the lowest among all South African metros and below 20% for the first time since 2009. Total employment hit an all-time record of 1.895 million. The Western Cape contributed 30% of the country's total job gains in Q4 2025, adding 31,000 jobs per month on average over the final three months of the year.
Set against a national unemployment rate of 31.4% and a national youth unemployment rate of 57%, Cape Town's performance is exceptional. The city's economic strategy has focused on high-growth sectors including tourism, BPO (business process outsourcing), technology, financial services, and construction, and it has been effective. Over R6.4 billion in investments and 15,000 jobs were directly secured in 2024 through the City's support of 11 industry growth partners.
The catch: a dual economy
But beneath the aggregate numbers is a persistent structural problem. Cape Town's youth unemployment rate, while lower than the national figure, spiked to 52.7% in Q2 2025. That means more than half of job-seekers aged 15–24 in the metro could not find work. The city's informal economy remains relatively small, which points not to prosperity but to high barriers to entry for low-skilled entrepreneurs.
Where Western Cape job growth is happening (Q4 2025)
Source: Stats SA QLFS Q4 2025. First three cards: Western Cape provincial gains (YoY). *Starred: national figures for context.
Cape Town's jobs story: the quarterly rollercoaster
Source: Stats SA QLFS, City of Cape Town.
The City has responded with targeted interventions. The YearBeyond programme, SME accelerator initiatives (including a partnership with the JSE), and a Township Action Project aimed at bringing economic opportunities closer to where people live are all in various stages of rollout. The Western Cape Government's Growth for Jobs strategy, launched as the province's apex priority, has focused on reducing red tape, attracting private investment, and improving skills pipelines.
Cape Town vs the metros: an unemployment comparison
Source: Stats SA QLFS, Q4 2025. Cape Town strict unemployment rate.
Forward LookingChallenge 5: Climate Vulnerability & Energy
Cape Town sits at the intersection of multiple climate risks. The Mediterranean climate that defines its rainy winters and dry summers is becoming more unpredictable, with longer hot seasons and less reliable rainfall. The 2026 wildfire season in the Western Cape was the worst in a decade, with over 132,000 hectares burned province-wide and fires threatening Franschhoek, Signal Hill, and the Helderberg in January alone.
The energy picture: better but fragile
On the power front, the news is considerably better than it was two years ago. South Africa went nearly a year without national load shedding through late 2025, as Eskom's generation recovery plan reduced unplanned outages by over 2,300 MW year-on-year. Eskom posted a R25.9 billion profit, its first in years.
Cape Town has gone further than any other metro in securing energy independence. The City's strategy includes adding 1,000 MW of independent power supply over time, with the first 650 MW expected to protect against up to four stages of load shedding. In 2025, the City secured R2.8 billion in concessional financing from the German Development Bank (KfW) for electricity grid upgrades. Rooftop solar installations have proliferated across the suburbs, and the city's 98% electrification rate is ahead of national targets.
But climate risk runs deeper than energy
The fundamental climate challenge for Cape Town is not electricity. It is water, fire, and sea level. The Western Cape's wildfire seasons are getting longer and more costly. The provincial government invested over R30 million in fire-service augmentation and aerial firefighting resources in 2025 alone. The City's 2050 Long-Term Plan explicitly identifies climate change as a threat multiplier that will exacerbate every other challenge the city faces.
Rainfall Uncertainty
The city's water supply depends entirely on winter rainfall captured in six mountain dams. Climate models indicate growing unpredictability, with drier winters becoming more frequent. The City's New Water Programme targets diversification, but it is years from full delivery.
Wildfire Exposure
Over 132,000 hectares burned in the Western Cape in the 2025/26 fire season, the worst in a decade. Urban-wildland interfaces in areas like Hout Bay, Simon's Town, and the Winelands are particularly vulnerable as development pushes closer to fire-prone vegetation.
The Outlook: Can Cape Town Hold It Together?
There is a provocative 2025 analysis by the Institute for Security Studies titled "The Cape Mirage?" that poses a question many have been privately asking: whether the Western Cape's model (competent governance, infrastructure investment, political stability) is truly sustainable, or whether it is merely a delayed entry onto the path of dysfunction that characterises most rapidly urbanising African cities.
The honest answer is: it depends on which Cape Town you are looking at.
Cape Town A: The Success Story
Record employment. A tourism economy worth tens of billions. Energy resilience ahead of the rest of the country. The highest household incomes, lowest unemployment, and strongest service delivery of any South African metro. A growing tech sector. International accolades. Construction cranes on every skyline.
Cape Town B: The Structural Crisis
Over 200 informal settlements. A housing waiting list exceeding 600,000. Youth unemployment above 50%. A Gini coefficient of 0.63. Persistent gang violence on the Cape Flats. Dam levels falling. Transport costs consuming 40% of poor households' income. A spatial layout that still mirrors apartheid.
The critical question is whether Cape Town A, the city of record employment, investment, and infrastructure, can grow fast enough to absorb Cape Town B, or whether Cape Town B grows fast enough to overwhelm Cape Town A. The demographic arithmetic is not encouraging: the population is growing at roughly 1.7% annually, with three-quarters of new arrivals in the low-income bracket. The property market is inflating faster than incomes. The water infrastructure is years behind demand.
The demographic pressure: Cape Town's population trajectory
Source: Stats SA Census 2011 & 2022, UN World Urbanization Prospects, MacroTrends. 2026 estimated, 2030 projected.
What gives cause for cautious optimism
Cape Town, for all its problems, is doing several things that no other South African metro is doing at scale. It has the strongest municipal balance sheet in the country. It is investing R40 billion in infrastructure over three years. It built more affordable housing units than any other metro (202,070 since 1994). It is the only major city with a credible energy independence plan. Its LEAP crime-reduction programme is producing measurable results. And it has a provincial government that, whatever its political limitations, takes data-driven governance seriously.
What gives cause for concern
The ISS analysis points to a structural contradiction at the heart of the model: the very policies that have made Cape Town attractive (low crime in affluent suburbs, clean governance, good infrastructure) are pulling in skilled workers and capital that drive up costs and push low-income residents further to the margins. The rising cost of living is beginning to slow semigration, with some evidence of "reverse semigration" back to Gauteng. School waiting lists in Cape Town are growing. Traffic congestion is worsening. And the social fabric in places like Bo-Kaap, where generations-old communities are being priced out by foreign buyers and Airbnb conversions, is fraying.
The five challenges, connected
What makes Cape Town's situation distinctive is how tightly its challenges are interlocked. Water scarcity is worsened by population growth, which is driven by semigration, which is fuelled by the city's relative competence, which raises property prices, which deepens inequality, which concentrates poverty in informal settlements, which have the highest crime rates and the weakest infrastructure. Climate change makes all of it worse.
There is no single policy that addresses this knot. But the data suggests that Cape Town has a window, perhaps a narrow one, in which its institutional capacity, economic momentum, and infrastructure investment pipeline can build enough resilience to absorb the pressures. Whether that window closes before the infrastructure arrives is the defining question of the next decade.
Frequently Asked Questions
Quick answers to the questions readers ask most about Cape Town's challenges in 2026.
Is Cape Town running out of water again?
Not yet, but the trend is serious. Dam levels crossed below 50% for the first time this season in late March 2026, sitting at 49.2% compared to roughly 66-68% at the same point in 2025. The City has declared an "Early Drought Caution" and is urging a 10% cut in household use. If consumption stays above target and winter rainfall is average or below, storage could dip to 40% by May, which would likely trigger formal water restrictions.
Unlike the 2018 "Day Zero" crisis, the City now has alternative water sources in development (desalination, water reuse, groundwater), but these are still years from full delivery. The short-term picture depends heavily on whether residents can reduce daily use below 975 million litres and on how much rain falls between May and August.
How safe is Cape Town compared to other South African cities?
Cape Town did not appear in the five worst-ranked South African cities in the 2026 Numbeo Crime Index (those were Pietermaritzburg, Pretoria, Johannesburg, Durban, and Gqeberha). This is because crime in Cape Town is highly concentrated in specific areas, primarily gang-affected suburbs on the Cape Flats, rather than diffused across the metro.
Affluent suburbs like Constantia, Camps Bay, Tamboerskloof, and Newlands have safety profiles comparable to prosperous neighbourhoods in Europe or Australia, supported by private security, CIDs, and LPR camera networks. The Cape Flats, by contrast, experiences extreme levels of gun violence, gang activity, and drug-related crime. Total crime per 100,000 population has fallen significantly over two decades (from ~8,000 to ~5,000), and murder in LEAP deployment areas dropped 3.7% in Q3 2025/26.
Can ordinary residents still afford to live in Cape Town?
It depends on income level and location. The average home price in Cape Town now exceeds R2.5 million (roughly $135,000/€125,000), and a typical bond repayment on that amount runs around R21,000 per month before rates and levies. A one-bedroom rental in the City Bowl or Atlantic Seaboard costs roughly R12,500/month, about 47% more than a comparable unit in Johannesburg.
For middle-income households, affordability is being squeezed by a combination of semigration (skilled workers from Gauteng pushing up prices), foreign buyers, and the conversion of long-term rentals to Airbnb-style short-term lets. The City is responding with a planned 135% rates increase on short-term rental properties and accelerated land release for affordable housing. The Western Cape housing waiting list exceeds 600,000 applicants.
Is load shedding still a problem in Cape Town?
As of early 2026, South Africa has gone nearly a year without national load shedding, following a major improvement in Eskom's generation performance. Cape Town is further insulated than other metros because of its independent energy strategy: the City uses the Steenbras Dam pumped-hydro scheme, private embedded generation, and demand management to reduce stages of load shedding relative to the national schedule.
The City has secured R2.8 billion in concessional financing from the German Development Bank (KfW) for grid upgrades and is targeting 1,000 MW of independent power supply. However, analysts warn that if the national economy grows significantly, load shedding could return because fundamental generation capacity has not expanded. Cape Town would be among the best-prepared metros in that scenario.
What is "semigration" and how is it affecting Cape Town?
Semigration refers to the internal migration of South Africans from one province to another. Since the COVID-19 pandemic, significant numbers of skilled, higher-income professionals have relocated from Gauteng (Johannesburg and Pretoria) to the Western Cape, drawn by better governance, lifestyle, coastal living, and relative safety. StatsSA estimates approximately 500,000 people will have migrated to the Western Cape between 2021 and 2026.
The effect is double-edged. Semigrants bring skills, tax revenue, and consumer spending that boost the local economy. But they also bring higher purchasing power that inflates property prices, lengthens school waiting lists, and adds pressure to water and transport infrastructure. There is now evidence of "reverse semigration" as some people return to Gauteng due to Cape Town's rising cost of living and return-to-office mandates from major employers.
What is Cape Town doing about inequality?
Cape Town's Gini coefficient stands at 0.63, making it one of the most unequal cities globally. The spatial divide between affluent suburbs near the mountain and coastline and sprawling townships on the Cape Flats still reflects apartheid-era planning. About 14% of households (roughly 185,000) live in informal settlements, and 57.9% of the population lives below the upper-bound poverty line.
The City has delivered 202,070 affordable housing units since 1994, more than any other South African metro, and handed over 12,401 affordable homes in the past five years alone. It has released more land for affordable housing in the last two years than in the previous decade. The provincial government's Growth for Jobs strategy, Township Action Project, and YearBeyond youth programme are all designed to address economic exclusion. But the structural challenge of apartheid spatial planning, limited land supply, and income disparity is generational rather than solvable in a single budget cycle.
Is Cape Town a good place to move to in 2026?
For skilled professionals with stable income, Cape Town offers South Africa's lowest unemployment rate (19.8%), strongest municipal services, highest household incomes, and best infrastructure investment record. The city was ranked 6th globally and named the world's most beautiful by Time Out in 2026. Tourism, tech, financial services, and BPO are all growing sectors.
The trade-offs are real, however. Housing is significantly more expensive than in Johannesburg or Pretoria. Water security is a developing concern. Traffic congestion has worsened. And the cost of living, while still favourable by international standards, is rising faster than in other South African metros. For lower-income households, the picture is less encouraging: youth unemployment remains above 50%, the affordable housing backlog is enormous, and the city's economic boom has not yet translated into broad-based prosperity on the Cape Flats.
How does Cape Town's economy compare to other South African metros?
By most measures, Cape Town leads. It has the lowest unemployment rate of any major metro (19.8% vs 31.4% nationally in Q4 2025), the highest labour force participation rate (68.8%), and added 113,000 jobs year-on-year, outpacing all other metros. The Western Cape contributed 30% of the country's total job gains in Q4 2025 despite having only 12% of the national population. Construction sector growth in the province ran at 34% while contracting nationally.
Cape Town contributes approximately 70% of the Western Cape's GDP and around 10% of national GDP. Its economy is predominantly services-driven (80%), with strong positions in tourism, financial services, tech, agriculture, and BPO. The main vulnerability is the dual-economy structure: high-growth formal sectors coexist with persistent exclusion of low-skilled workers and a relatively small informal economy.
Sources & References
- Employment & Economy: Statistics South Africa, Quarterly Labour Force Survey Q4 2025; City of Cape Town EPIC Report Q2 2025; Western Cape Government Growth for Jobs Strategy
- Water: City of Cape Town Weekly Water Dashboard; DWS dam-level reports; Cape Argus, IOL water reporting (Feb–Mar 2026); es-capetown.com dam-level tracker
- Crime: SAPS Quarterly Crime Statistics Q2 & Q3 2025/26; Western Cape Government crime briefings (Dec 2025, Feb 2026); Wikipedia – Crime in South Africa; CrimeHub.org
- Housing & Property: Stats SA Residential Property Price Index; FNB Property Barometer; Lightstone Property Analytics; Seeff Property Group; The Africanvestor housing analysis; Al Jazeera Bo-Kaap reporting (Mar 2026); Daily Maverick affordability investigation (Jan 2026)
- Inequality: World Bank Gini Index; Western Cape Socio-Economic Profile 2023; Social Europe – Tackling Inequality in Cape Town (Nov 2025); IMF Six Charts (2020); UN World Urbanization Prospects
- Climate & Energy: Eskom generation reports; City of Cape Town Energy Strategy; BusinessTech energy reporting; Wikipedia – South African Energy Crisis; Western Cape 2026 State of the Province Address
- General: Time Out Best Cities 2026; Cape Town 2050 Long-Term Plan; ISS African Futures – "The Cape Mirage?" (2025); MacroTrends Cape Town Population; StatsSA Mid-Year Population Estimates 2025
You May Also Like

The Minibus Taxi System as Social Infrastructure | Cape Town's Invisible Transit Network
Photo courtesy of FreddieA, Wikimedia Commons, licensed under CC BY-SA 3.0 The Minibus Taxi System as Social Infrastructure | Cape Town's Invisible Transit Network |…
Read Article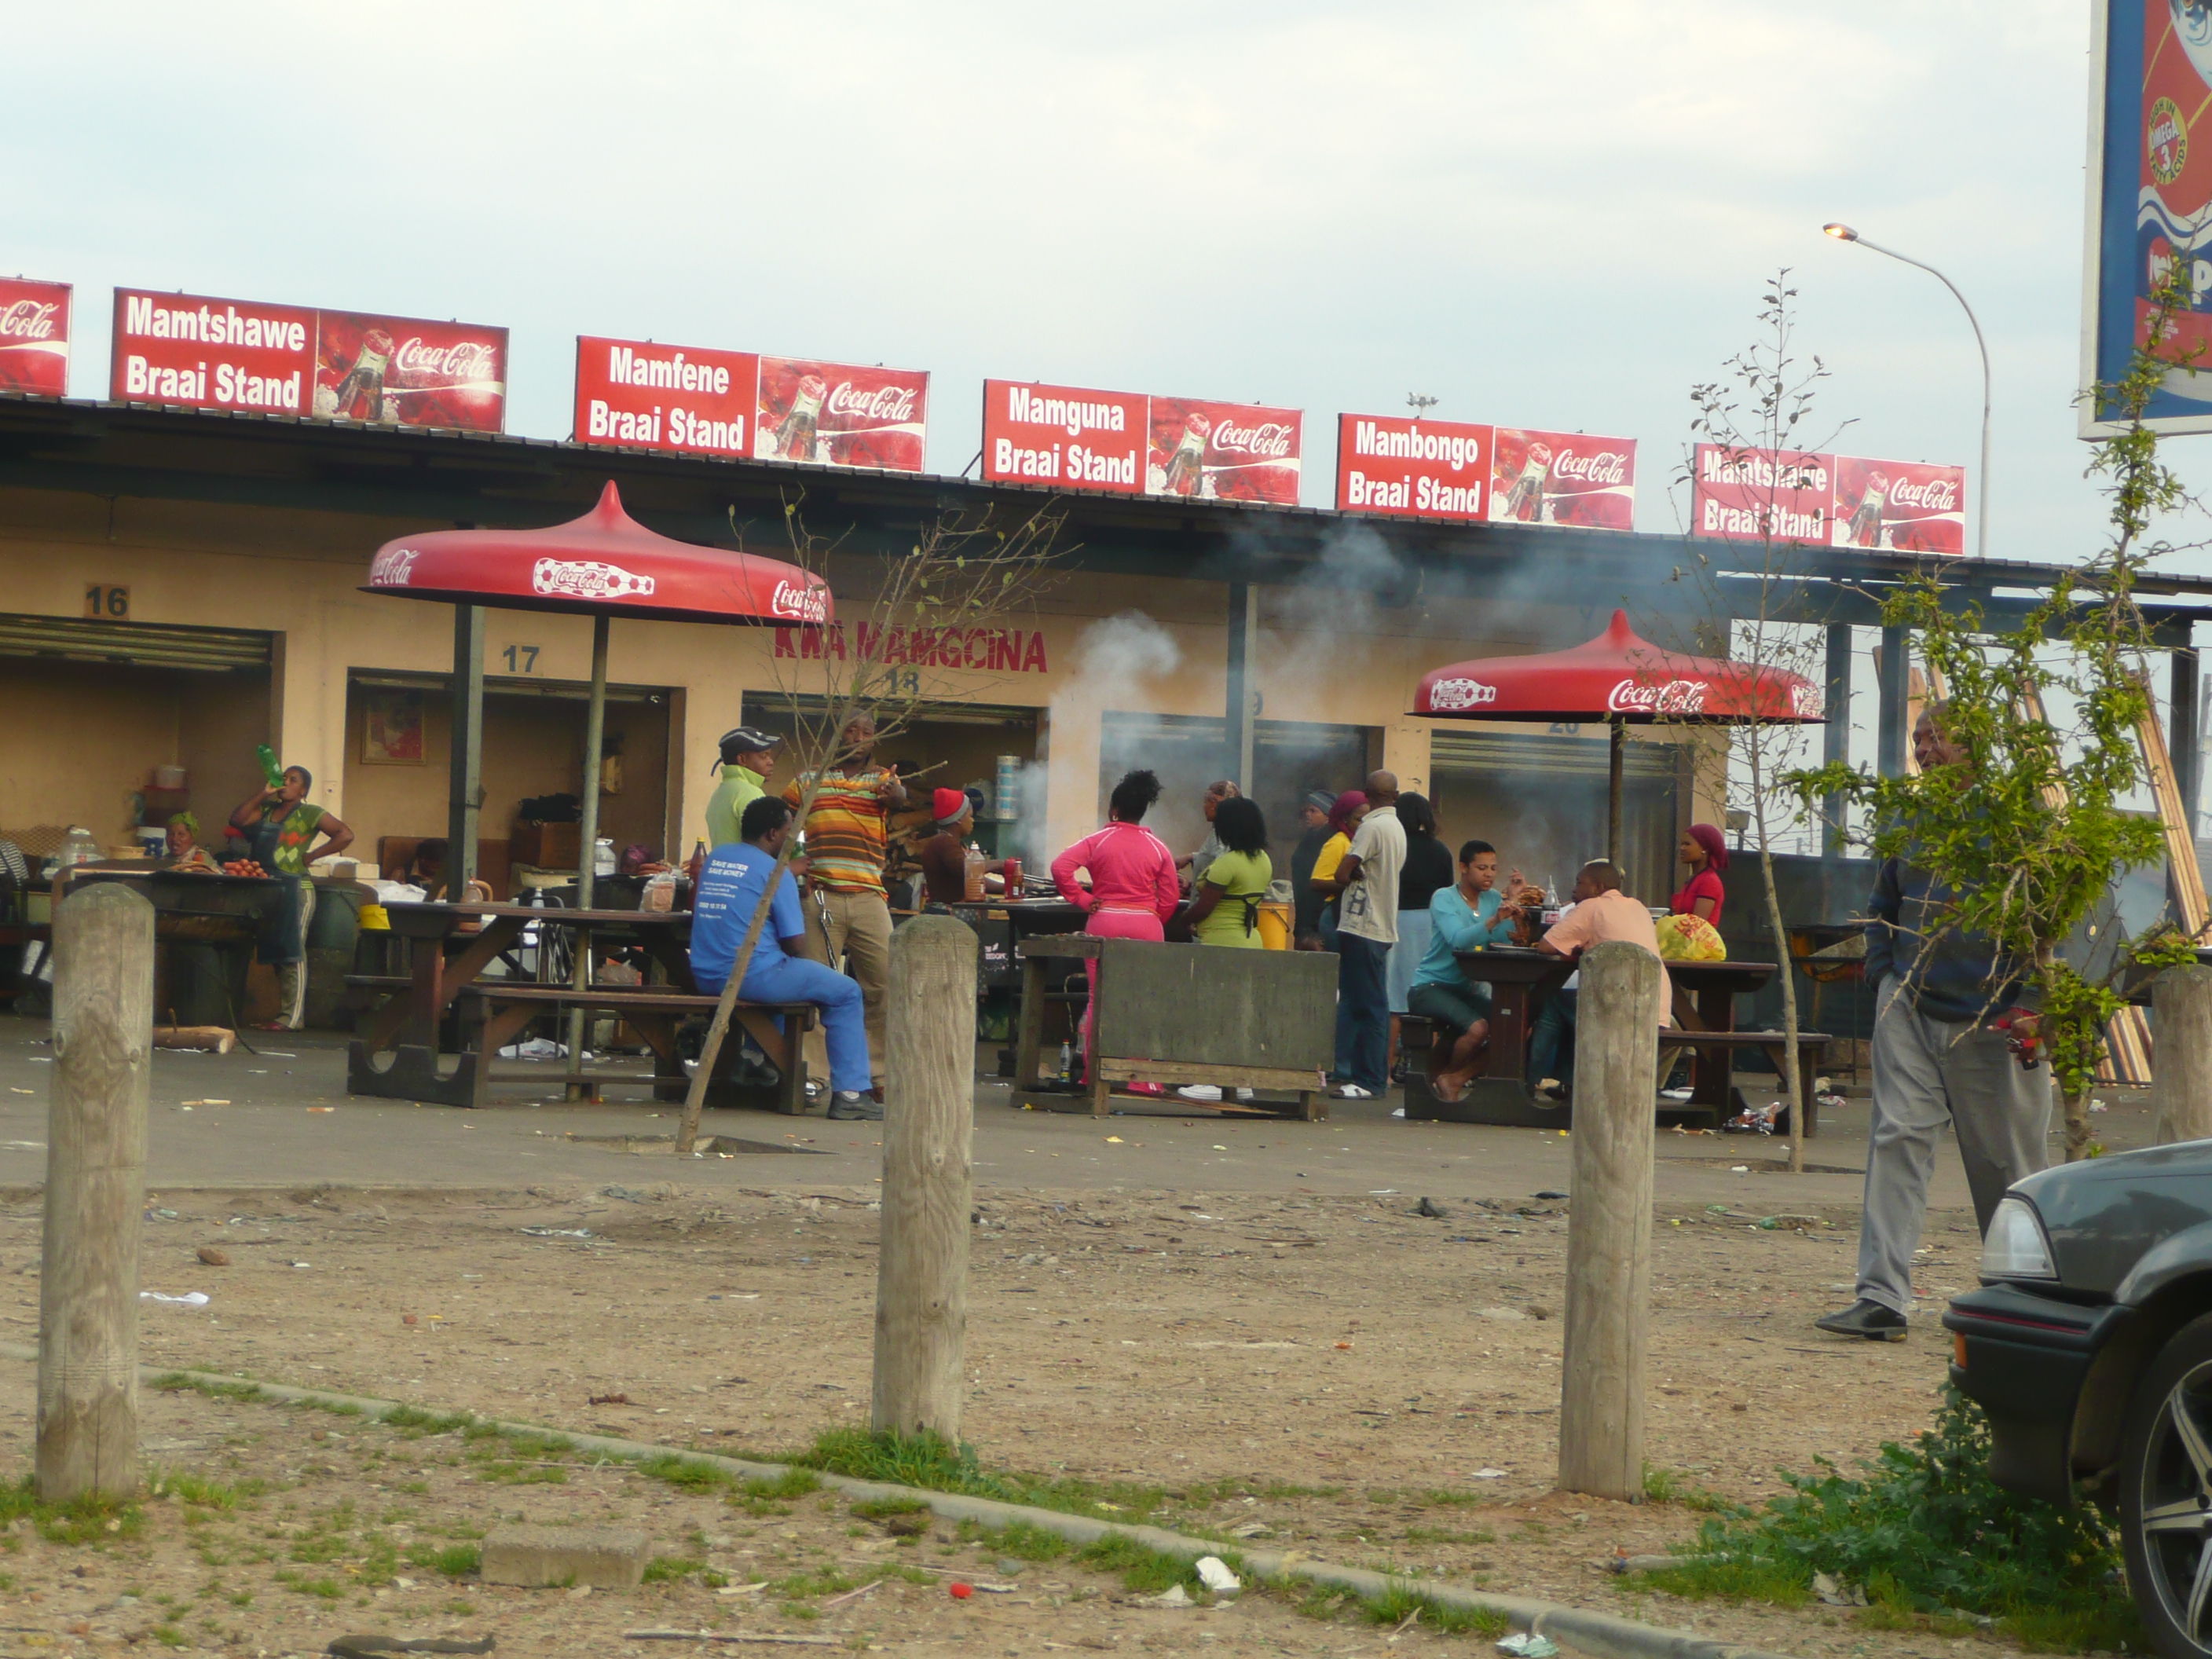
The Culture of Township Economies in Cape Town | Spaza Shops, Salons, Street Food & Informal Innovation
Cape Flats · Cape Town · Culture Guide The Culture of Township Economies in Cape Town Spaza shops, hair salons, shisa nyama stands, stokvels, and…
Read Article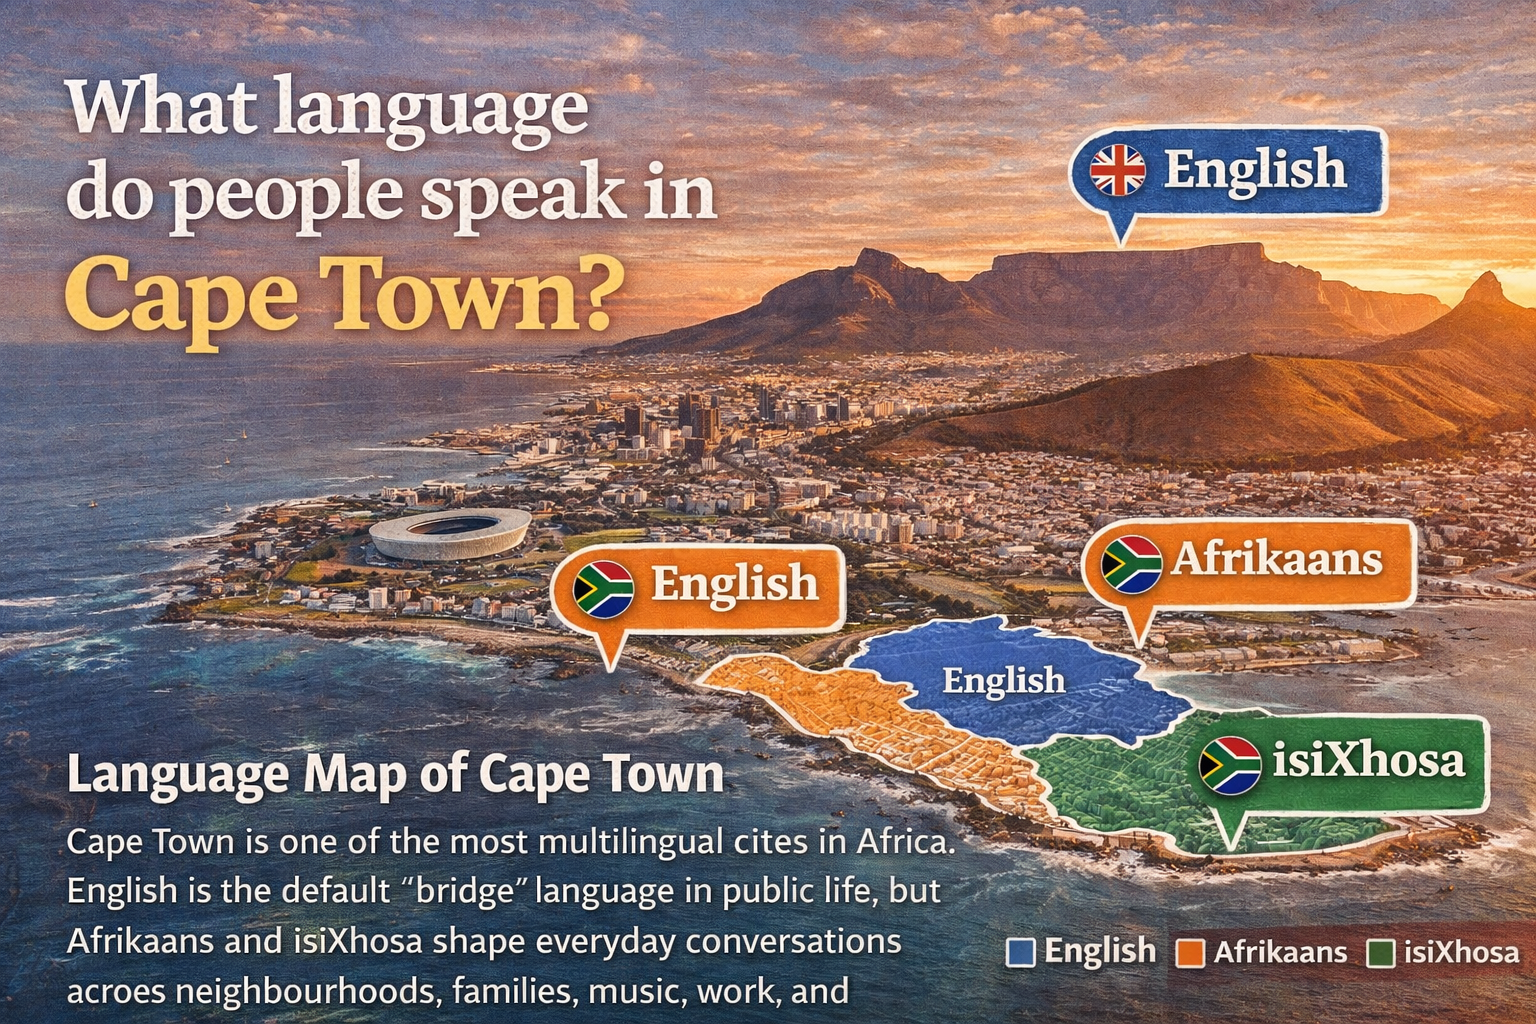
What language do people speak in Cape Town?
Cape Town Culture Guide · 2026 Language Map of Cape Town Cape Town is one of the most multilingual cities in Africa. English dominates in…
Read Article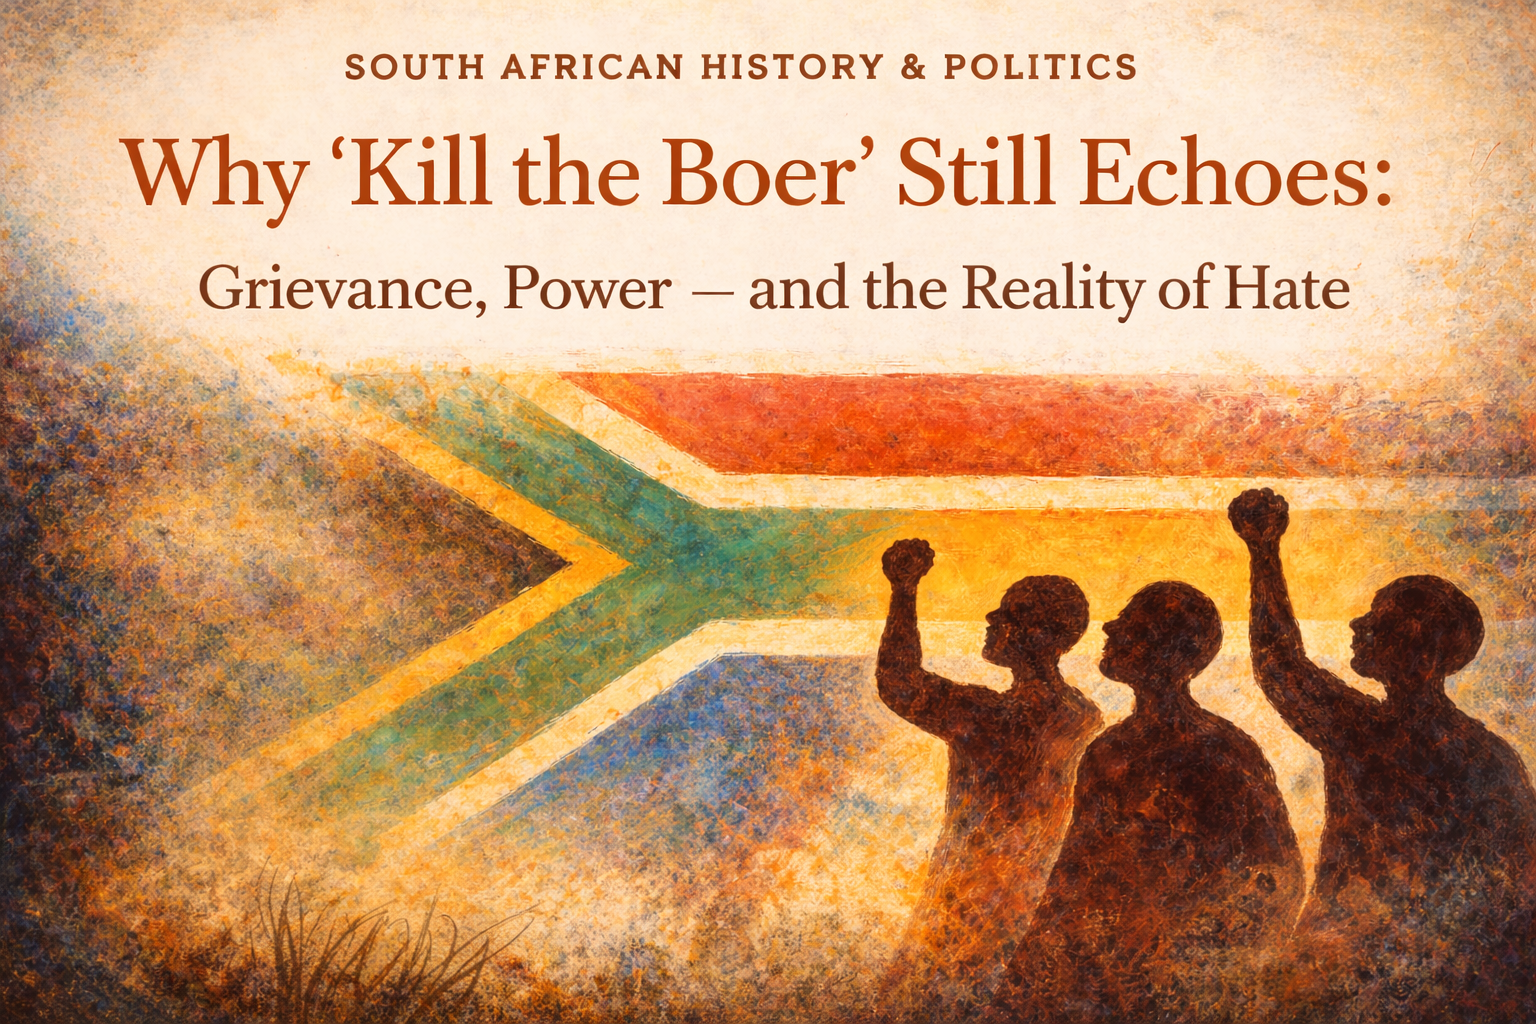
Why “Kill the Boer” Still Echoes: Grievance, Power - and the Reality of Hate | Analysis
Skip to article Home / Analysis / South African History & Politics Copy link Share Jump to Analysis · South African History & Politics Why…
Read Article
How to donate and engage in Cape Town in ways that actually support long-term, dignified solutions, instead of accidentally keeping people on the street, feeding unhealthy systems, or making things harder for local organisations.
How to Donate Responsibly in Cape Town (Without Doing Harm) Photo courtesy of Chris Parsons (CC BY-SA 4.0) via Wikimedia Commons. Responsible Travel • Giving…
Read Article